
A Tool for Managing Risk, Return, and SII
Ardea Investment Management has developed a specialised tool that aims to assist investors to determine optimal portfolio allocations on a three-dimensional efficient frontier. Unlike the traditional Markowitz model, which primarily considers risk and return, Ardea’s tool incorporates the additional dimension of Solvency II capital requirements. By extending the efficient frontier into a three-dimensional surface, insurance investors are offered an increased capacity for analysing and optimising investment strategies.
Figure 1: Three dimensional frontier – Ardea’s Insurance Optimisation Tool
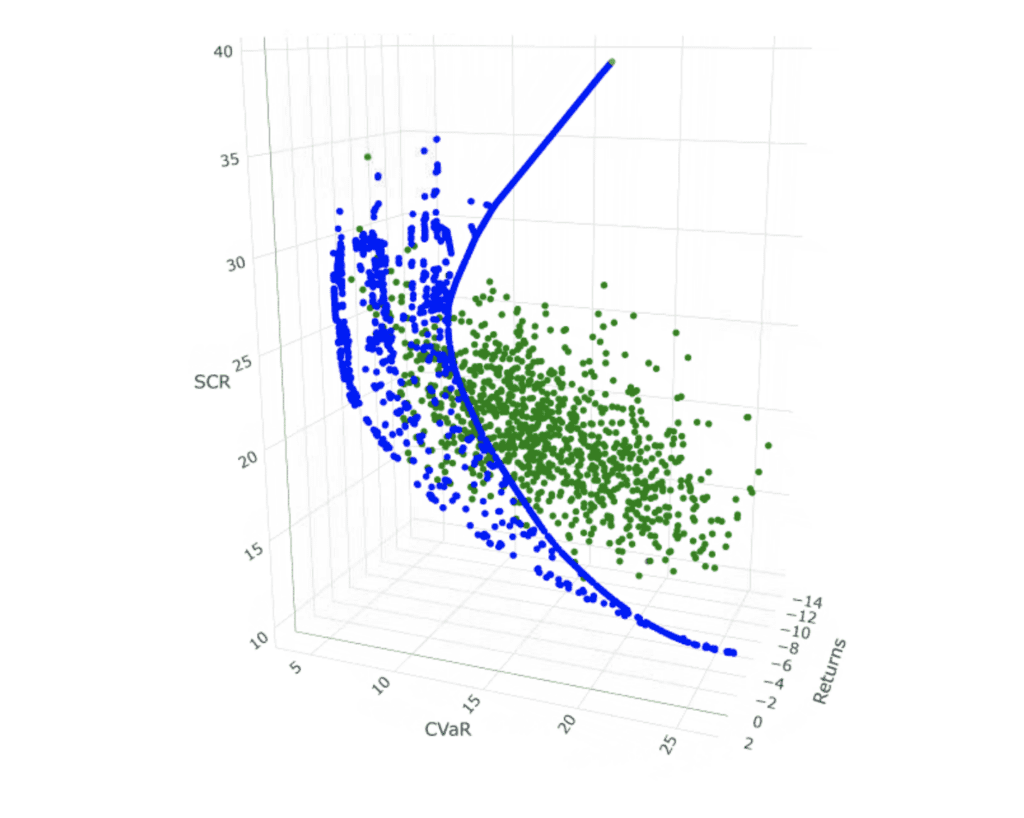
One valuable lesson that has been observed through the implementation of an efficient frontier approach, is that no single asset class consistently performs well across different market regimes. The dynamic nature of markets necessitates a continuous evaluation of investment options. While insurers historically have always had to account for the difficulties of managing to three competing objectives, the complexities of this challenge have been amplified in recent years due to factors such as the lingering impact of COVID-19, the LDI crisis, and the effects of quantitative easing policies, which have prompted rising inflation and subsequently rising interest rates. Due to the volatile market conditions experienced in recent years, it has become increasingly difficult for investors to assess the capital efficiency of various asset classes. But Ardea has developed a tool to help overcome this challenge.
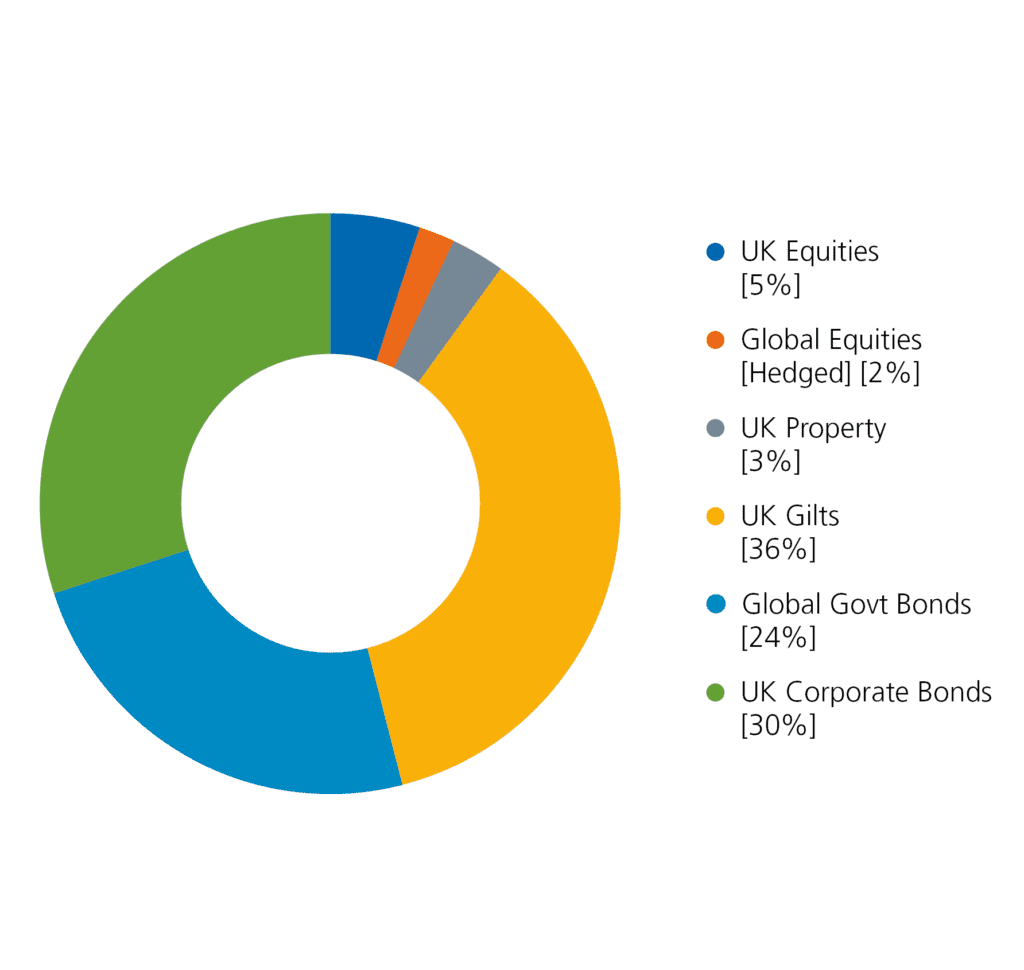
To illustrate this, Ardea has conducted a comprehensive analysis of a typical UK insurance general account portfolio (Figure 2) using our in-house tool for risk, return, and Solvency capital requirements over different historical periods. This analysis covered the tumultuous market upheaval caused by the COVID-19 pandemic, the 2022 financial year to include the impacts of the UK LDI crisis and the SVB collapse, as well as the performance in the last 3 years to July 31st 2023.
Figure 2: Typical UK Insurance General Account
By utilising our specialist tool, insurance investors can enhance their decision-making processes and proactively respond to market shifts. This enables them to make informed adjustments to their portfolios, ensuring they remain well-positioned amidst evolving market dynamics.
The trade-off
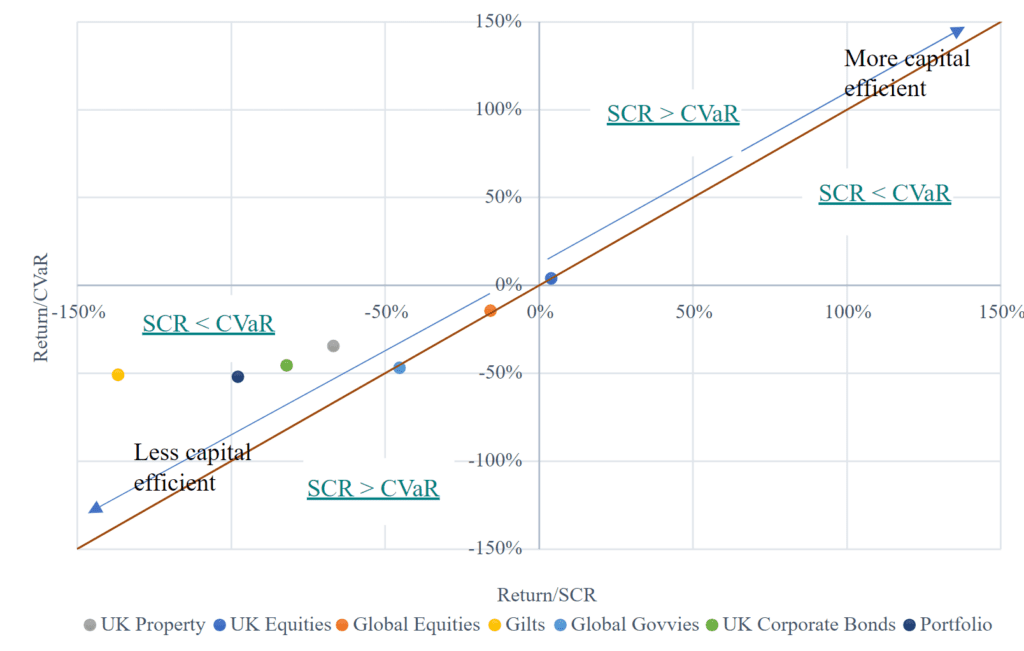
To effectively visualise the efficacy of different asset classes under different market regimes, Ardea has chosen to plot each asset class’s return to the Solvency Capital Requirement (SCR) ratio against its return to conditional value at risk (CVaR) ratio (Figure 3). In an ideal regulatory world, Risk and SCR would be directly correlated. However, this is not always the case and as such, normalising risk and SCR by returns allows asset classes to be compared as it isolates the risk versus return versus capital trade-off that is central to this discussion. Ultimately, both high return/CVaR and high return/SCR is the goal. If we think about the orange line in the same way as we think about an efficient frontier, then any asset which sits further along the line in the direction of the blue arrow is considered more capital efficient than an asset closer to the origin. Assets with a negative return (i.e. those in the third quadrant) are less capital efficient than assets with a positive return (i.e. those that sit in the first quadrant). A comparatively higher return/SCR (i.e. which sits down and to the right of the orange line in the first quadrant of the plot) indicates that the investment is requiring less capital than the risk would imply. Alternatively, assets which sit above the line in the first quadrant implies that more regulatory capital is being held than market risk (CVaR) implies.
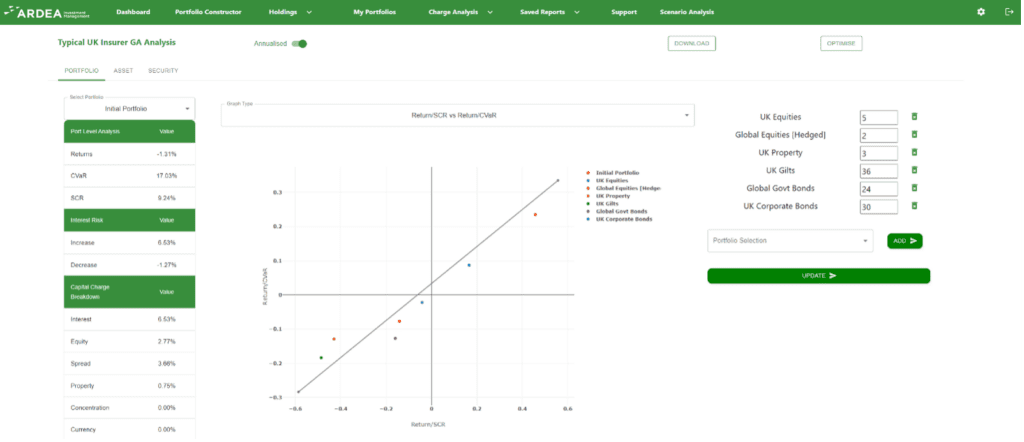
For example, during the 12-month period starting from March 2020 (as shown in Figure 3), Global Equities displayed a notably high return over the SCR ratio (46%). Additionally, it exhibited a return over CvaR ratio of 29%, signalling lower regulatory charges compared to the associated market risk. In contrast, gilts are positioned above and to the left of the trade-off line in the third quadrant during this period. This suggests that for this specific period, an investor is holding less capital than the CVaR implies whilst also maintaining negative return. The negative return outweighs the CVaR/SCR trade-off rendering the investment inefficient compared to the other asset classes. Figure 4 shows how the trade-off chart appears in Ardea’s web based optimisation tool.
Figure 3: COVID Period (2020)
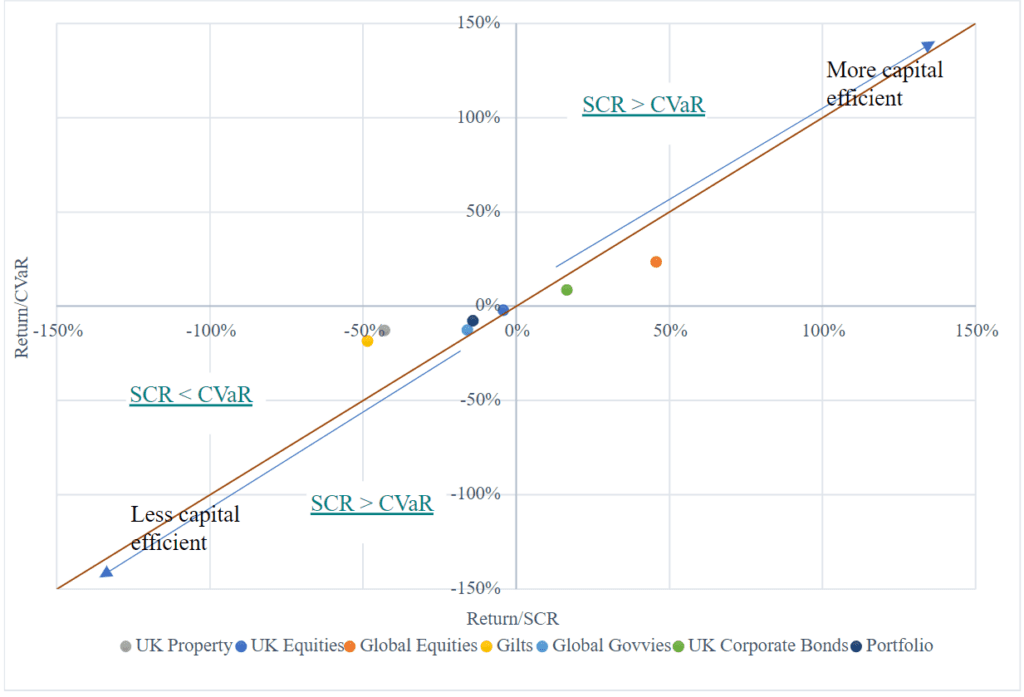
Figure 4: Trade off chart – Ardea’s Insurance Optimisation Tool
A year of volatility
The financial landscape of 2022 was characterized by unprecedented challenges, with events unfolding against the backdrop of high inflation and the persistent rise in interest rates stemming from the lingering effects of the COVID-19 pandemic and the invasion of Ukraine. In the latter part of 2022, the Liability-Driven Investment (LDI) crisis struck, triggering an unprecedented surge in yields on long-dated UK government bonds. This crisis, which unfolded in September and October 2022, forced UK pension funds to fund substantial and abrupt cash collateral demands, undermining the stability of the gilts market. These events were compounded by the subsequent collapse of Silicon Valley Bank (SVB) in March 2023, which reverberated throughout the global banking sector and led to abnormal returns in global equity markets.
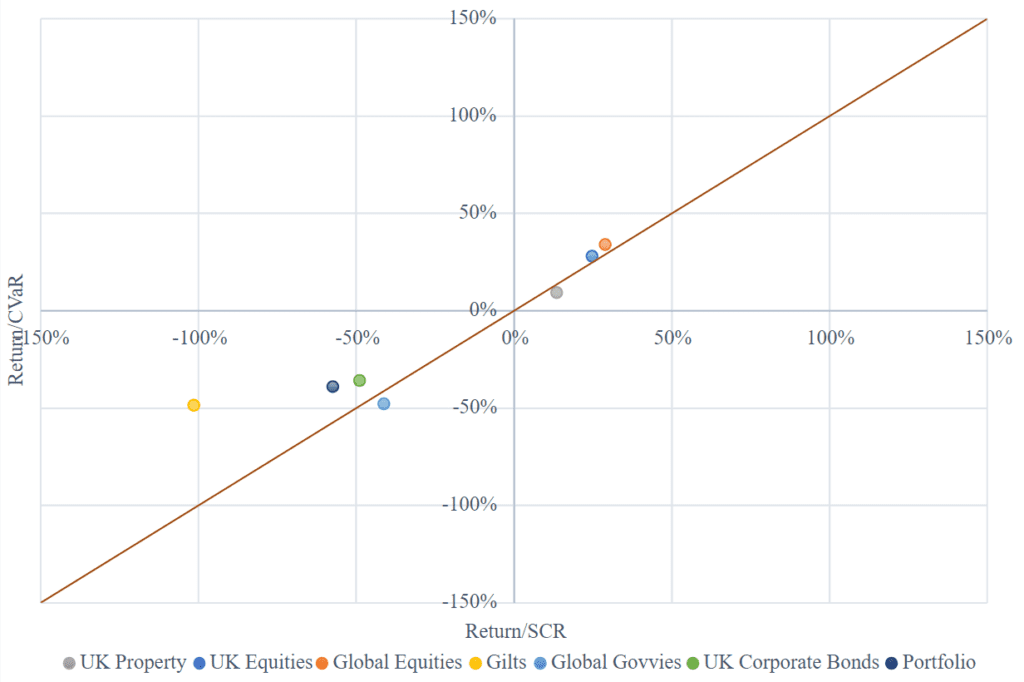
Throughout this period, the analysis revealed that, Global equities and UK equities exhibited the highest level of capital efficiency (Figure 4). However, the returns for Global equities were negative during this period (-6%) so the analysis identified UK equities as the most favourable asset class. It is also worth noting that domestic fixed income assets were the most capital inefficient during this period, as they lie furthest away from the origin on both a return/CVaR and return/SCR basis in the third quadrant. Given that they sit above the orange line, the conclusion can be reached that due to the high volatility of this period, the realised risk of holding gilts exceeded the risk implied by the associated solvency capital requirement. If we compare UK property with say Global Government Bonds, the relative efficiency is not as clear. This is because UK property exhibited a superior return to CVaR ratio, but inferior return to SCR ratio when compared to Global Government Bonds. Neither dominates the other on both measures. In contrast, we have already seen that UK equities dominates all other asset classes on both ratios.
Figure 5: 2022/23 FY
The last three years
Extending our analysis to cover the last 3 years from August 1st, 2020, to July 31, 2023, we found Global equities, UK equities and UK property to be the most efficient (Figure 5). Poor performance from fixed income has led to equities and property being the only asset classes for this period with positive returns, and thus are more desirable over this period regardless of their CVaR vs SCR trade off.
These findings highlight the significance of continuous modelling and portfolio adjustments to navigate changing market dynamics effectively. However, it is important to acknowledge that investment decisions can be highly constrained and need to consider various factors such as liability considerations, regulatory requirements, and internal investment policies. Consequently, it may not always be feasible to remain precisely on or near the efficient frontier.
Nevertheless, knowledge of the most capital-efficient allocations can serve as a valuable tool in identifying new investment opportunities that may not be readily apparent through traditional risk-return analysis. By recognising these potential opportunities, investment strategies can be refined to capture returns that might have otherwise been overlooked.
In the current economic landscape dominated by rising interest rates and inflation, insurance investors are confronted with critical choices in managing their general accounts. As rates increase, the potential for better returns from core, less capital-intensive debt may alleviate the pressure to pursue asset classes with high capital requirements and instead seek resilient yields and favourable Sharpe ratios.
Figure 6: 1 August 2020 – 31 July 2023
A changing regulatory world
Amidst the dynamic shifts in regulatory landscapes, including the UK’s departure from the EU and the emergence of Solvency 2.5 in Europe, Ardea Investment Management underscores the vital significance of adaptability and foresight. Ardea’s cutting-edge solution, fully customisable to anticipate and evaluate regulatory shifts, emerges as a pivotal asset for proactively addressing potential alterations to the Solvency Capital Requirement. Of particular significance is the potential introduction of a climate change capital requirement.
Ardea, in collaboration with the University of Technology in Sydney (UTS) and Fortlake Asset Management, has conducted insightful research on the influence of climate change on government bond yields, as outlined in the paper “Climate Transition Risk in Sovereign Bond Markets.” We leverage this research to estimate the projected increase in yields for government bonds due to their exposure to climate change transition risks.
The analysis using our tool focused on assessing the potential impact of a climate-related charge on fixed income assets. This analysis was carried out on a portfolio consisting exclusively of global government bonds to isolate the potential implications for this asset class. Subsequently, our analysis revealed that, in the absence of green bonds within the portfolio, it would incur elevated capital charges. Specifically, without any green bonds, the portfolio would face an 8.68% Solvency Capital Requirement when subject to a climate change charge, as opposed to a 7.28% requirement without this charge.
Conversely, when introducing a balanced 50/50 allocation between government bonds and green government bonds, the portfolio exhibited a significant reduction in climate-related capital charges. In this scenario, the portfolio showed a 7.67% Solvency Capital Requirement, which increased to an 8.07% requirement with the application of the climate change shock. This underscores the critical importance of employing tools to monitor regulatory changes and adjust portfolio allocations judiciously in a dynamic investment landscape.
Conclusion
Compliance with Solvency II presents a myriad of challenges to the insurance industry. For those entrusted with managing often sizable and intricate investment portfolios, the challenge lies in striking a balance between traditional risk and return objectives and the Solvency Capital Requirement (SCR).
The genesis of Ardea’s three-dimensional portfolio optimisation tool stems from the need to address these intricate challenges. However, this tool is not limited to the insurance sector; it also proves invaluable for investors in other domains. For instance, it can assess the ramifications of regulatory shifts, model the impact of introducing new assets on portfolio performance, and facilitate scenario analysis for economic variables like interest rates and credit spreads. We are actively pursuing the incorporation of environmental variables, exploring their influence on portfolios, both independently and in a landscape where factors such as climate change introduce capital charges for insurers.
In a world characterised by pervasive uncertainty, the ability to adapt and optimise investment strategies is imperative for insurance investors to prosper amidst the continually evolving challenges they encounter.
Please refer to the important information in the attached document. The fund referenced in this document is only available in Austria, Belgium, the UK, Germany, Finland, France, Ireland, Italy, Luxembourg, Sweden and any other jurisdiction where this fund may be available without registration.