
Extreme volatility; where can investors take shelter?
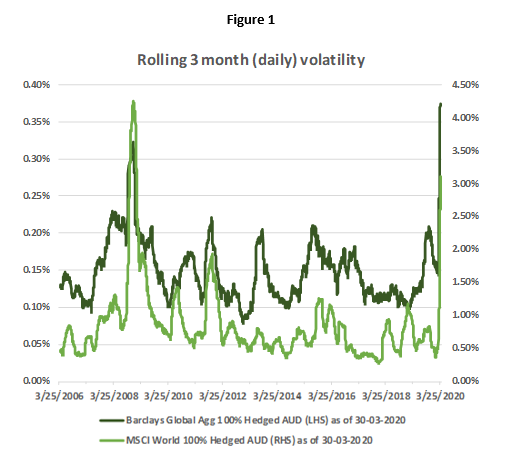
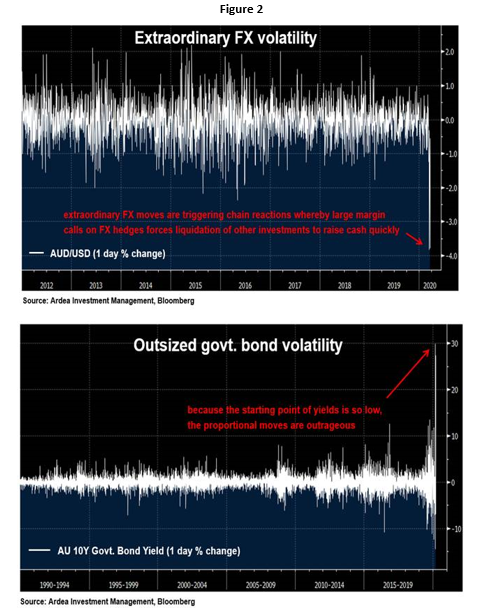
In a market where every asset class seems to be at the mercy of volatility, investors are left wondering if there are any real safe havens anymore. Figure 1 below shows the rolling 3 month volatility of daily returns for the MSCI World total return index and the Barclays Global Aggregate total return index. Equity markets have experienced a steep increase in volatility recently, and while they are yet to reach the peaks of 2008, many commentators are expecting volatility to increase further. Realised volatility for global bond markets has exceeded the peaks observed during 2008 (Figure 1) and a couple of weeks ago, Australia’s Government bonds and currency exhibited the kind volatility normally only seen in emerging markets (Figure 2):
But there are some strategies which benefit from market volatility, and these are known as “Long Volatility” strategies. A long (bought) interest rate straddle is an example of a long volatility strategy and involves buying a call and put on an interest rate security, with the same strike and expiration date1. The strategy exhibits these characteristics:
- Returns are asymmetric; there is a much higher upside potential than downside.
- The maximum downside risk is limited to the (small) cost of the options and is known with certainty up front
- Returns from these strategies are uncorrelated with markets (the strategy is non directional and not dependent on bond or equity markets)
- Positive Gamma, which allows the investor to gain exposure to interest rate markets in a favourable way. For example, a bond option buyer’s exposure to the bond market is increasing when bond prices are increasing and decreasing when bond prices are decreasing.
Figure 3 below shows the pay off at maturity of a long straddle using bond options. The investor will make a profit if the underlying bond price moves far away from the strike price (either higher or lower). So, a straddle is a good strategy for those times when volatility is high, but the investor is uncertain about which direction the market will move (very much like today’s markets!!). Figure 3 also shows the capped risk (the most the investor can lose is the cost of the put premium plus the call premium) and the uncapped profit potential.
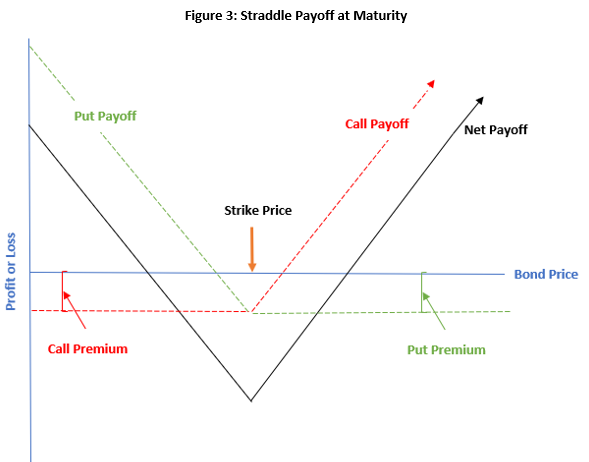
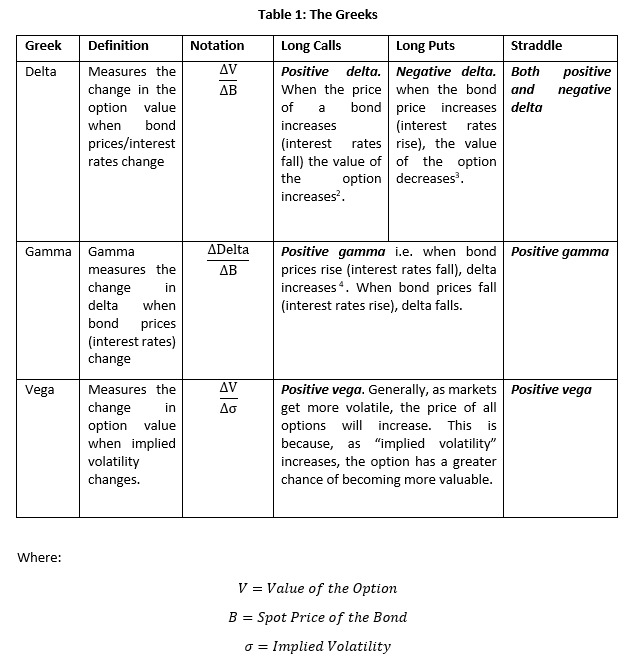
If the chart above shows the payoff to the investor at maturity, then how does an investor profit from these strategies prior to expiration of the put and the call? To answer that question we have to meet the “Greeks”! Since our strategy involves purchasing a put and a call, our daily P&L will be a direct function of the value of those two options. The “Greeks” measure the sensitivity of the value of those options (and therefore our straddle) to various risks. Table 1 below provides more detail:
And so the daily P&L on our straddle can be estimated as:
Daily P&L = Delta P&L + Gamma P&L + Vega P&L + Other5
However, recall that we are implementing this strategy to take advantage of volatile markets. So we want to strip out any exposure to the direction of interest rate markets while maintaining exposure to the increasing volatility of those markets. This means we want to keep delta at zero but maintain exposure to vega. We can do that by implementing a process called delta hedging. Delta hedging is the process of keeping the delta of a portfolio consisting of assets and options on those assets, as close to zero as possible. This usually involves buying or selling some quantity of an asset such that the total market exposure from the asset plus the options is approximately zero.
Note that while we are mostly interested in exposure to vega, keeping exposure to gamma helps us to also profit from the delta hedging process. So in total there are two sources of profit; volatility and gamma. When a position is delta-hedged, the daily P&L on a delta-hedged option position then equals:
Daily P&L = Gamma P&L + Vega P&L + Other
Some examples will help to illustrate:
1. Profiting from positive gamma
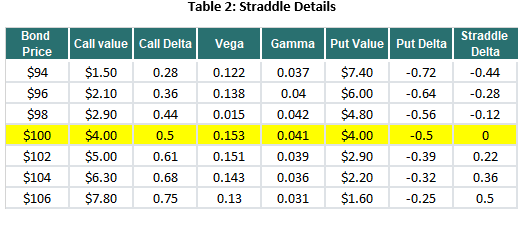
Initially when an investor buys an At The Money (ATM) straddle6, the delta on the position is zero because the delta of the call exactly offsets the delta of the put (see the highlighted yellow row in the table). An ATM call option has a delta of approximately 0.50 (if the bond price goes up 1 dollar, the call option’s price goes up by 0.50). An ATM put option has a delta of approximately -0.50 (if the bond price goes up 1 dollar, the put option’s price goes down by 0.50). If you hold both options at the same time, the total delta of your position is the sum of the two deltas (i.e. zero).
However, when the price of the underlying bond changes so does the delta. To ensure the position is not exposed to changes in interest rates, the investor needs to adjust the delta back to zero via delta hedging. Due to positive gamma, this process of delta hedging then generates profits as we show in the following example.
Suppose the bond price is initially $100, and you purchased 10 straddles with a strike price of $100 and that each option gives the holder the right to buy or sell 100 bonds. The value of one straddle is $8.00 (one call and one put at $4 each).
Now suppose that the bond price increases from $100 to $102, the straddle is now worth $7.90, and the delta has moved to 0.22 (0.61 – 0.39). To negate that delta, you could sell (short) 220 bond futures7 (i.e. delta of 0.22 x 10 straddles x the right to buy or sell 100 bonds).
Now suppose that the bond price moves back to $100, the straddle is now worth $8.00 and the delta moves back to a net of zero. Given that you previously sold short 220 bond futures at $102, and you can now buy those same futures for $100, your P&L gain is $440 ($2 X 220 bond futures).
So in general positive gamma allows profits from delta hedging by buying low and selling high:
- bond prices increase -> deltas increase -> hedge delta by shorting bond future ->selling when prices increase
- bond prices decrease -> deltas decrease -> hedge delta by buying bond future ->buying when prices decrease
A final point to make is that the sensitivity of that option to changes in bond prices (interest rates) actually increases the more rates move. This means the gains from delta hedging also increase with increased volatility. So for this kind of strategy, vol is good, but more vol is better!
2. Profiting from exposure to vega
We first need to distinguish between realised and implied volatility. Implied volatility is the expected volatility of the underlying asset, given the price of the options. Realised volatility is the observed volatility in the underlying asset. You can read more about implied and realised volatility here. Vega is the change in an option’s value for a change in implied volatility. Ideally the best time to buy a straddle is before expectations of increasing market volatility have been priced in. i.e. the net profit from changes in implied volatility is determined as:
Vega P&L = Vega × (current implied volatility − original implied volatility)
However, timing the market is difficult (some might say impossible!). So, instead we maintain a constant exposure to these strategies within our portfolios. During extremely volatile periods (where implied volatility also increases), these strategies provide large profits, but during other times the strategy may not be profitable at all. This means that to ensure the portfolio can generate reliable returns, we combine these long volatility strategies with a diversified range of relative value strategies. In this way, we are well positioned to take advantage of unexpected spikes in volatility without sacrificing returns during less volatile periods.
Conclusion
Pure volatility trades profit in extremely volatile markets and are immune to directionality. To implement a pure volatility trade an investor can buy a call and a put, with the same strike on the same underlying asset. This structure is known as a straddle. Then via a process termed “delta hedging”, the investor can neutralise the position to movements in the value of the underlying asset while also locking in profits. These strategies are particularly valuable during tail risk events such as the GFC and the steep market declines we have seen recently as a result of COVID-19. Given the difficulties with forecasting tail risk events, Ardea IM maintains a constant exposure to these types of defensive strategies.
1 Interest rate options are derivative instruments that allow the buyer to gain exposure to changes in interest rates. For example, a bond option gives the holder the right to buy or sell a bond at a specified price (the strike). A bond’s main exposure is interest rates. A call option on a bond gives the holder the right, but not the obligation, to benefit from rising bond prices (falling interest rates). The investor holding the call option earns a profit if, at the expiry of the option, bond prices (interest rates) rise (fall), more (lower) than the strike price. The converse is true for put options.
2 Delta ranges between 0 and 1 for calls
3 Delta ranges between -1 and 0 for puts
4 For puts as the price of the underlying increases, the delta increases (from −1 to 0). For calls as the price of the underlying increases, the delta also increases (from 0 to 1)
5 Includes P&L from financing and other greeks (theta, rho, vanna and volga)
6 A long call and long put of the same strike and expiration date where the strike is equivalent to the current spot price of the underlying
7 Bond future are exposed to the same market risks as bonds but are more liquid versions
This material has been prepared by Ardea Investment Management Pty Limited (Ardea IM) (ABN 50 132 902 722, AFSL 329 828). It is general information only and is not intended to provide you with financial advice or take into account your objectives, financial situation or needs. To the extent permitted by law, no liability is accepted for any loss or damage as a result of any reliance on this information. Any projections are based on assumptions which we believe are reasonable, but are subject to change and should not be relied upon. Past performance is not a reliable indicator of future performance. Neither any particular rate of return nor capital invested are guaranteed.