
Investment Grade Credit Relative Value
Investment grade (IG) credit has been one of the worst performing asset classes so far this year, and its largest segment – USD IG credit – has been the worst hit.
USD IG credit has posted a loss of 4.2% over just the past 6 months1, having been hurt by rising rates and widening credit spreads. That’s a big loss for a ‘defensive’ investment that was only offering an annual yield of c. 4% to begin with.
The average credit spread on that index (i.e. excess return over US treasuries) reached a low point of in early February and has since widened by 0.5%, which translates to a capital loss from credit exposure of 4.2%2 … again a big loss for a ‘defensive’ investment.
What’s really unusual is that US equities and US high yield credit are about flat over this period, despite both being considered the ‘riskier’ investments.
Based on this it might be tempting to conclude that an underperformance of this magnitude makes the ‘safer’ investment grade space look cheap against riskier alternatives.
But first, it’s worth considering the following;
- IG investors are taking more interest rate risk because the duration of the IG credit market has been increasing as corporates have taken advantage of lower rates and strong investor demand to lock in cheap long dated debt funding
- IG investors are taking more default risk because the credit quality of the market has deteriorated as BBB- rated issuers (the lowest quality IG companies) now account for over half the market vs. a third in 20063
So IG credit has been left offering less return for more risk.
When you can now get 2.5% from a 2 year US treasury, the extra 1.3% you get from reaching for yield into IG credit (with 4 times the interest rate risk) is no longer as appealing as it used to be, and faced with such a choice, the increasingly unfavourable risk vs. reward proposition of IG credit becomes more important.
Therefore one reason the ‘safe’ asset is underperforming is that an even safer asset has been rapidly catching up in terms of the returns on offer. So rather than IG credit being cheap relative to riskier investments, it looks expensive relative to the safer ones.
And when faced with all this, it’s not surprising that net fund flows into US IG credit have declined 45% compared to last year, as many of the yield seeking tourists who had ventured into IG credit return home to government bonds4.
So why hasn’t high yield credit been affected by the same dynamics? Perhaps it’s just the optics of a 6.5% yield on the comparable US high yield credit index feeling like it’s still a large enough number to justify hanging on a bit longer, even though risk-adjusted valuations are questionable.
Turning to IG credit in Australia, a similar dynamic is starting to play out but hasn’t yet advanced as far as in the US.
A popular asset allocation strategy to maintain yields while reducing duration has been to allocate to short duration credit or floating rate notes, for example via portfolios tracking the Bloomberg Ausbond Credit 0-3 year or Credit FRN indices.
In both these spaces as well, returns have been eroded by widening credit spreads.
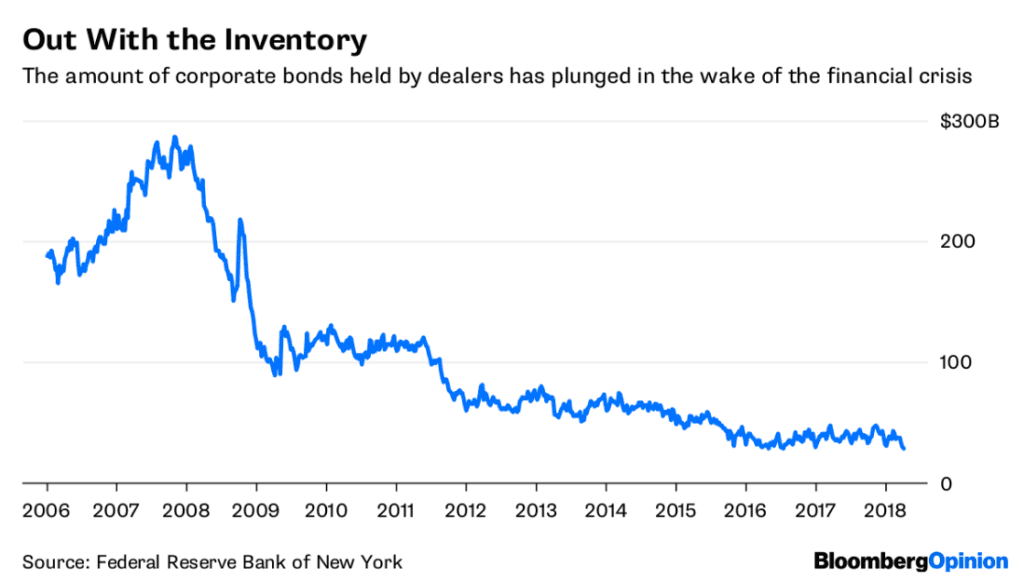
A final point to consider is that IG credit has generally been considered a liquid asset class, even though it’s not exchange traded and is therefore entirely reliant on a small group of banks to facilitate liquidity.
It’s not widely appreciated that since the 2008 financial crisis, increased bank regulation, higher capital charges and growing balance sheet constraints have severely hampered the ability of banks to continue performing this function.
In particular, the willingness and ability of banks to accumulate inventories of bonds when investors want to sell is a key driver of liquidity and as the chart below shows, these inventory levels have collapsed since 2008.
Up to now this structural deterioration in liquidity hasn’t been felt because it has been offset by extremely strong ‘reach for yield’ flows into credit markets.
If this dynamic reverses, liquidity will be severely stressed and the remaining credit tourists might well find themselves stuck.
Ardea Investment Management
1 total return on Bloomberg Barclays USD Liquid Investment Grade Index
2 based on index duration of 8.6 years
3 source Goldman Sachs credit research
4 source Bank of America Merrill Lynch