
Market Mechanics: The Greenium Puzzle
Sovereign green bonds are often assumed to trade richer than their conventional peers – a pricing effect known as the greenium. In theory, strong ESG demand and limited supply should support persistent valuation premiums but as the market matures, the greenium narrative is becoming more nuanced, with recent trends revealing fragmentation, inconsistency, and fading premiums.
According to market data, euro area sovereign green bonds have recently exhibited a modest average greenium of around -2.8bps. This is perceived to be a sign of enduring investor preference, but beneath the surface, the drivers of this premium defy simple explanation.
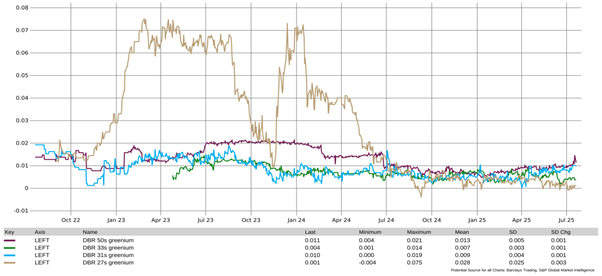
Germany provides the cleanest test case through its twin bond structure, where green Bunds are issued alongside conventional equivalents with identical terms. The greenium here has historically been clearest, largely due to relative scarcity (green issues average €9bn vs. €33bn for twins). Yet even in Germany, greeniums have narrowed in recent months, with dispersion evident across the curve. While all German green Bunds show a modest premium relative to their conventional twins, the levels vary by maturity and have trended lower over time. The DBR 27s greenium, in particular, has compressed sharply since early 2024, illustrating how even well-structured programmes do not guarantee stable or uniform pricing effects.
Figure 1: Greenium on selected German Bunds (DBR 27s, 31s, 33s, 50s).
Source: Ardea IM, based on Barclays Trading and S&P Global Market Intelligence.
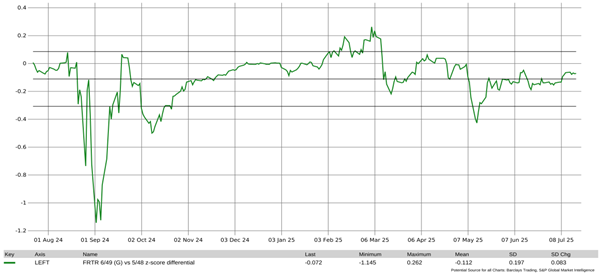
France highlights the idiosyncrasies of the green bond market. A good example is a comparison of the FRTR 6/49 green OAT versus the 5/48 conventional OAT – two bonds with near-identical maturity and structure. At times, the green bond has traded significantly richer, showing a clear greenium, but that premium has proven unstable, narrowing sharply in early 2025.
This relationship is captured in the below chart using a z-score differential, which measures the relative richness or cheapness of the green bond versus its comparator over time, normalised by historical spread behaviour. The chart shows how this z-score has fluctuated materially, highlighting that even within a single issuer’s curve, greeniums are not persistent. Specifically, they can emerge or fade based on investor flows, positioning, and market technicals, rather than structural differences.
Figure 2: Relative value of FRTR 6/49 green OAT vs 5/48 conventional OAT (z-score differential).
Source: Ardea IM, based on Barclays Trading and S&P Global Market Intelligence.
Italy offers another example of how greenium effects can defy conventional assumptions. Despite being viewed as a higher-risk issuer, Italy has at times exhibited the largest sovereign greenium, with greeniums surpassing -5 basis points on some issues.
This runs counter to the idea that credit quality or issuer credibility drives green bond pricing. In reality, these outcomes are often shaped more by technical factors (i.e. market mechanics!) such as issue size, investor demand, and relative scarcity, rather than any structural difference in creditworthiness or green credentials.
Like Germany and France, Italy issues green bonds under ICMA-aligned frameworks, meaning they follow the same internationally recognised standards for use of proceeds, transparency, and reporting. Yet its greenium has been both more pronounced and more volatile, reinforcing the case that bond-specific microstructure plays a greater role than issuer-level fundamentals.
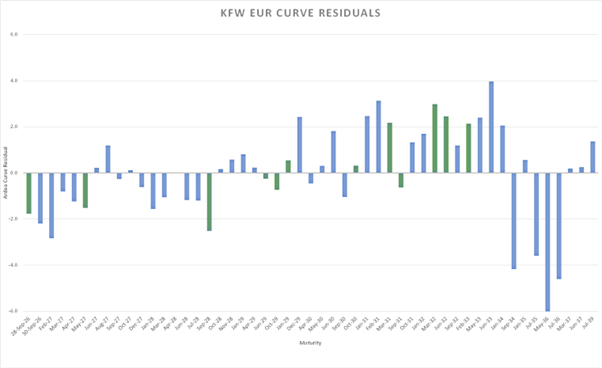
Looking across an issuer’s curve, it’s also clear that not all green bonds consistently trade rich or cheap. The curve residual – the number of basis points a bond trades away from its interpolated fair value – provides a snapshot of relative richness or cheapness. A negative residual indicates the bond is rich (expensive), while a positive residual suggests it’s cheap.
The KfW EUR curve illustrates this dispersion: green bonds (denoted by green bars in the chart) are scattered both above and below fair value. This shows that greenium is present in some maturities, but not others, reinforcing the point that bond-specific factors dominate – even within a single issuer.
Figure 3: Residuals from fitted KfW EUR bond curve.
Source: Ardea IM, based on Bloomberg data.
In summary, green bonds can offer a premium, but it’s neither consistent nor guaranteed. The greenium is increasingly bond-specific and maturity-sensitive and in some cases, may vanish entirely. For investors, that means looking beyond the label. Scarcity, structure, and liquidity – not just sustainability – are what count in pricing.
Important Information
This material has been prepared by Ardea Investment Management Pty Limited (Ardea) (ABN 50 132 902 722). Ardea is the holder of an Australian financial services licence AFSL 329 828 and is regulated under the laws of Australia.
This document does not relate to any financial or investment product or service and does not constitute or form part of any offer to sell, or any solicitation of any offer to subscribe or interests and the information provided is intended to be general in nature only. This should not form the basis of, or be relied upon for the purpose of, any investment decision. This document is not available to retail investors as defined under local laws.
This document has been prepared without taking into account any person’s objectives, financial situation or needs. Any person receiving the information in this document should consider the appropriateness of the information, in light of their own objectives, financial situation or needs before acting.
This document is provided to you on the basis that it should not be relied upon for any purpose other than information and discussion. The document has not been independently verified. No reliance may be placed for any purpose on the document or its accuracy, fairness, correctness or completeness. Neither Ardea nor any of its related bodies corporates, associates and employees shall have any liability whatsoever (in negligence or otherwise) for any loss howsoever arising from any use of the document or otherwise in connection with the presentation.