
Will Japanification Eliminate Relative Value Trading Opportunities in Rates Markets?
- Record low rates are leading some market participants to question whether all bond markets are experiencing “Japanification” and if this backdrop spells the end to relative value trading opportunities in interest rate markets.
- Low bond yields do not necessarily mean the market is pricing Japanification – inflation expectations and risk assets point to a different conclusion.
- Central bank policy is not homogenous – the cross-market variances are substantial and an important driver of interest rate curves.
- Bond supply is rising rapidly, which has implications for risk premiums and relative value in government bond markets.
- We show some relative value distortions in rates markets have recently increased.
Many investors have expressed concerns about the future of the fixed income market in a world of extreme monetary policy. Some common concerns are that all bond markets are turning Japanese or that government bonds are now “return-free risk”. Japan or not, global bond markets now have a reduced yield buffer, which limits the capacity for duration-only strategies to protect multi-asset portfolios (see here for further discussion). But what about the significant returns on offer and diversification benefits from relative value trading strategies in the rates market? Will these opportunities disappear because of “Japanification”? We think not. There are signs that the new regime in rates markets will result in more, rather than less, relative value opportunities.
Low bond yields do not necessarily foreshadow Japanification
The term Japanification is typically used to describe the enduring stagnation of economic growth and persistent deflation, as experienced in Japan. Some of the frequently cited structural causes of Japanification are:
- the bursting of a debt and asset bubble;
- demographics that weigh on long term growth expectations;
- fiscal and monetary policy mistakes that took many years to reverse;
- an entrenched deflation mindset among consumers and businesses;
- labour market inflexibility.
The frequently cited rates market effects of Japanification are:
- very low bond yields;
- a collapse in rates volatility;
- large central bank intervention in bond markets.
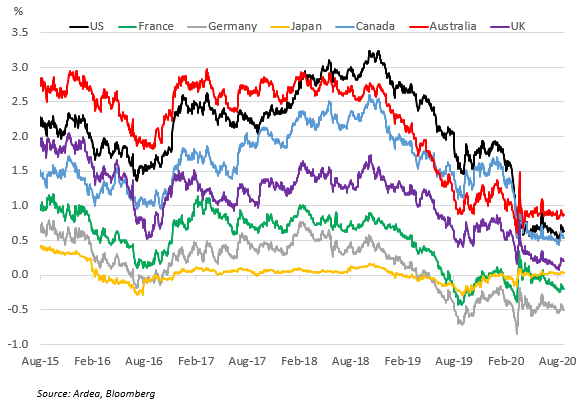
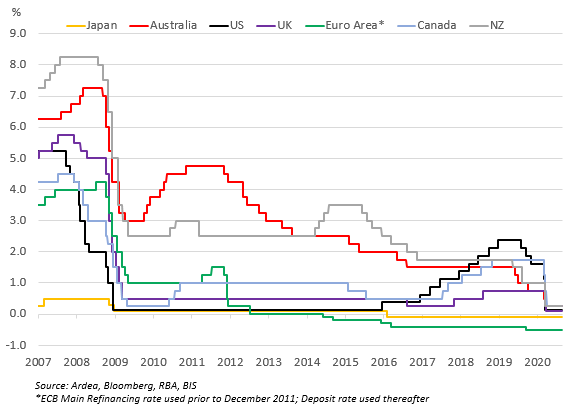
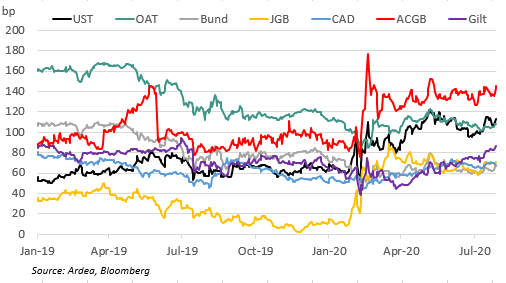
All three effects are at face value consistent with the current state of play across G10 rates markets (Chart 1), which is leading many market participants to make closer comparisons with Japan. While the recent causes of lower yields are similar everywhere, the structural economic context is very different. For example, Germany has had even lower bond yields than Japan for over a year and the gap has recently widened further, but Japan has experienced more consistent deflationary pressures over a longer period. The risk of economic Japanification across Europe, the US and other developed markets cannot be ruled out over the long run, given the difficulty in long run macroeconomic forecasts. But historically low yields and rates volatility belie quite different underlying market dynamics across the world that don’t suggest a uniform Japanification is currently taking place.
Chart 1: 10y bond yields
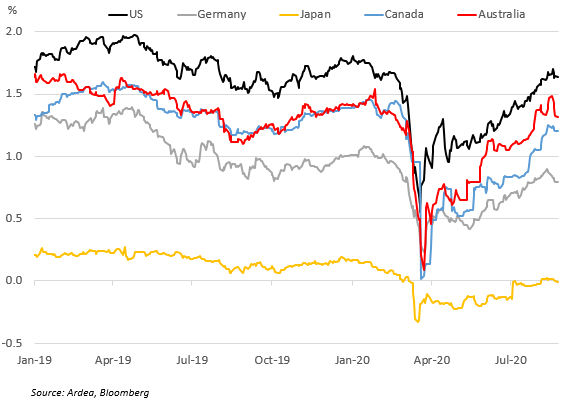
The clearest sign that the current market context is inconsistent with Japanification is in the behaviour of inflation expectations. By looking at the yield margin between nominal and inflation-protected bonds (for more information see here) – breakeven inflation rates (BEIs) – we see global ex-Japan bond markets more concerned with inflation than deflation (Chart 2). After initially collapsing amid the COVID-19 shock, inflation expectations have lifted sharply over the last couple of months (by over 100bp from March lows) to be at pre-COVID levels at longer term maturities. From a historical perspective, these expectations are still low and under most central bank targets. But they are telling us that investors don’t currently think deflation (economic Japanification) is the most likely outcome over the long run.
Chart 2: 10y market-implied Inflation expectations near fully recover post-COVID falls
Indeed, the timing of the bounce in BEIs is consistent with the strong bounce in stocks, credit markets and metal prices. Collectively, the recovery in these assets shown Chart 3 tells us that deflation and long term stagnation isn’t the base case for most investors. Why has this synchronised reflation occurred in the face of a major recession? Investors appear to be giving a lot of weight to the speed of the world’s monetary and fiscal policy response. This view contrasts with an often-cited criticism of Japan’s conservative response to the asset price collapse in the 1990s (another interpretation is simply that policymakers in other countries have learned from Japan’s experience). Investors are in uncharted waters in a post-COVID world, which could yet deliver greater upside risk to inflation than even the impressive recent recovery in BEIs suggests (the consequences of which could spill-over into nominal rates) or indeed a move towards deflationary risks. What is clearer is that Japanification is not yet the base case for most market participants, just because nominal rates are very low.
Chart 3: The rebound in inflation expectations is consistent with broader reflationary pricing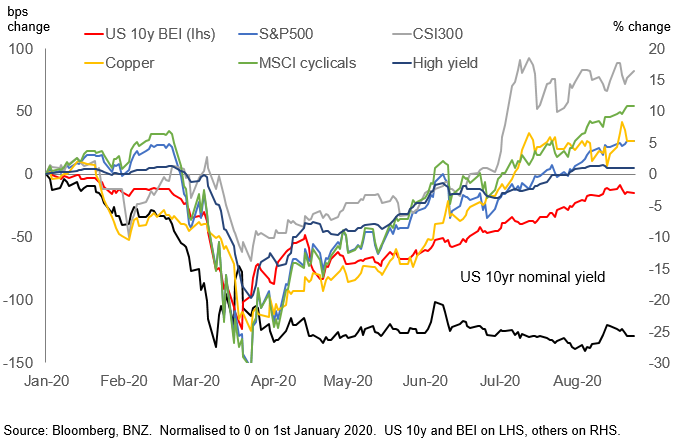
Extremely accommodative monetary policy is here to stay, but not all central banks are following the same script
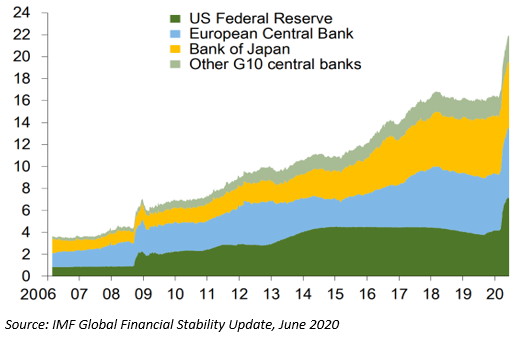
Ahead of the COVID-19 outbreak, global monetary policy settings were mostly highly accommodative and expected to remain so amid a tepid pace of global growth and well contained inflation. In response to the COVID-19 shock, central banks have taken policy measures to new extremes. All major central banks have taken respective cash rates close to or below zero and are enacting some form of QE. Central bank balance sheets have expanded aggressively – by US$6tn since mid-January across the G10 – more than double the increase seen during the 2008 crisis (Chart 4). Moreover, central banks have enacted extensive liquidity support measures to limit the fall-out from the virus on money market functioning. Even under the more optimistic COVID-19 recovery scenarios, it’s clear that monetary policy is likely to remain highly accommodative for the foreseeable future.
Chart 4: G10 Central Bank Assets (USD, Trillions)
In March 2020, central banks were proactive and near synchronised in timing their response to the unfolding shock. However, COVID-19 has exposed some major differences of views on the design and limits of unconventional monetary policy. There are two major sources of this policy divergence that are critical to relative value differences across yield curves:
1) Negative rates are not pervasive. The BoJ and ECB have had negative rate policies for several years, while the BoE and $-bloc central banks have all, so far, avoided negative rates. The BoE and RBNZ have openly contemplated moving down this path. In contrast, the Fed and RBA have expressed doubts about the effectiveness of negative rates and concerns about its side effects. For instance, negative rates could have adverse effects on money market functioning, pension fund returns, banking system functioning and confidence channels. Moreover, structural deflationary risks are not as significant a threat in the US or Australia, as in Japan or Europe. The experience of monetary policy since 2008 suggests one can “never say never”, but there are currently clear differences in views on the effective lower bound for policy rates across central banks.
The currency implications are important. Negative rates (at least at the institutional deposit level) lead to currency depreciation, which is mostly welcomed by central banks. However, a currency is a relative price, so in a scenario where negative rates extend to more central banks, the reflationary benefits of the policy become more muted and have a diminishing marginal benefit relative to costs. The currency impact is, however, a double-edged sword. If the largest financial market and economy – the US – moved into negative rate territory, it would make it difficult for central banks in smaller open economies like Australia not to follow due to an unwelcome rise in the value of their currencies.
Chart 5: Central bank policy rates
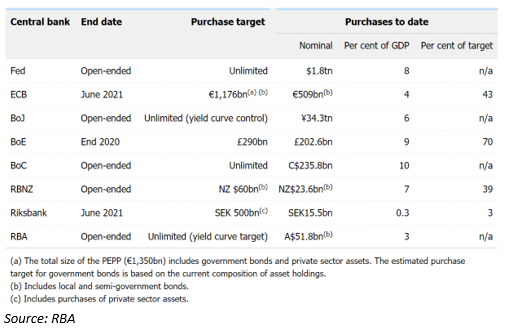
2) Large variance in asset purchase program design and scope. There is wide spectrum of central bank asset purchase programs, varying in terms of asset type, duration, quantity and nature of commitment to future purchases. For instance, the Fed currently has no formal US Treasury yield curve target and has scope to buy effectively unlimited levels of US Treasuries if needed, but the actual pace of purchases has dropped sharply over the last three months after running at a record pace through March and April. Similarly, the BoJ has no fixed cap on the level of purchases and nor does the RBA, although in practice RBA purchases have been significantly smaller than other central banks. Table 1 summarises the current state of play across major central banks and highlights the differences in yield targets.
There are considerable differences in credit appetite, with most but not all central banks buying either SSAs or regional government bonds and some central banks moving into corporate and financial credit (both in CP and longer dated bonds).
There are also important differences within the government sector. Some central banks, such as the Fed, ECB and RBNZ purchase inflation-linked bonds, whereas others like the RBA are only active in nominals. The duration of QE purchases also varies widely across countries. For instance, the Fed is active across the whole curve in US Treasuries, but the RBA has an explicit 3y target and at the time of writing has not purchased any Commonwealth Government bonds beyond 10 years.
It would be challenging for other many other central banks to achieve Japan’s level of yield stability without massive intervention. That is because many sovereign issuers rely on offshore investors to buy their government bonds, while Japan has a large domestic savings pool.
Table 1: Central bank net purchases of government bonds
Bond supply and fiscal policy are more important in a world of extreme central bank policy
Alongside massive monetary policy easing measures, governments are embarking on an unprecedented expansion of fiscal policies to support economies amid COVID-19. Fiscal policy is important given the sheer scale of the downturn and the fact that monetary policy was already stretched ahead of the crisis.
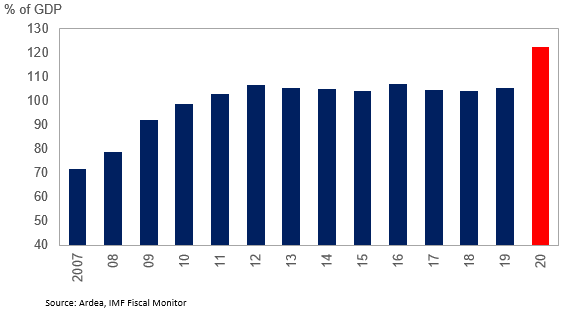
The magnitude of rising deficits and debt is staggering and is synchronised across the world. The IMF estimates global spending and revenue measures total US$3.3tn and loans, equity injections and guarantees total US$4.5tn. That stimulus builds on already high debt burdens – gross debt across developed economies had been sitting just over 100% of GDP ahead of COVID. The new spending measures and existing debt maturities mean bond issuance is rapidly rising.
Chart 6: Advanced economy gross debt levels
Some relative value distortions have increased, despite record low rates and large central bank intervention in bond markets
The surge in government bond supply coincides with record low bond yields and divergent approaches to implementing extraordinary monetary policy. This combination of extremes is changing the dynamics of fixed income markets. Some implications include:
- divergent yield curve shapes across G10 markets (Chart 7);
- rising new issuance yield premiums in sovereign markets;
- central banks suppressing some sectors of yield curves, but not other sectors – even the Japanese curve still exhibits significant positive slope;
- swap spread curves distorted by changing bond supply/demand dynamics;
- changing distribution of inflation risk premia across curves;
- tightening money market funding spreads.
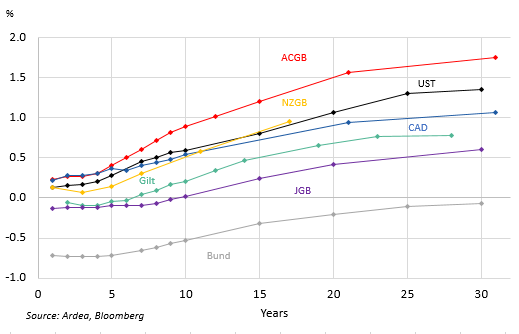
Chart 7: Selected Global Sovereign Yield Curves
We outline four examples of relative value distortions which have increased post-COVID. Note these examples are not trade or investment recommendations and are just a simplified guide to recent market themes.
1) Relative value across yield curves
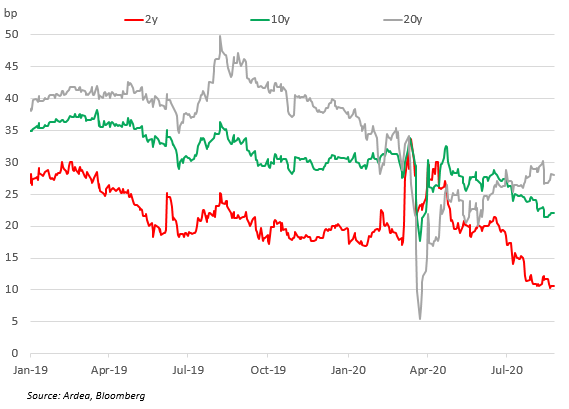
Even as yields have reached record lows, the shape of yield curves has tended to steepen and is not uniform across markets (Chart 8). The UST and AUD curves are notably steeper than Bund, JGB or Gilt curves (we outlined the relative cheapness of Australian long-dated bonds in a recent note). The supply/demand dynamics at play across markets vary through time, which will see these curve shapes continue to move around, providing opportunities to switch between different markets and maturities along yield curves.
Chart 8: 5y vs 30y yield curve spreads
2) New issue premiums
The huge wave of government bond supply hitting markets is leading investors to demand a greater yield premium for new bond issues (a discount in price terms). The purchase of bonds with offsetting short positions in similar parts of the yield curve can allow investors to capture the value in new bonds, while limiting exposure to broader market movements.
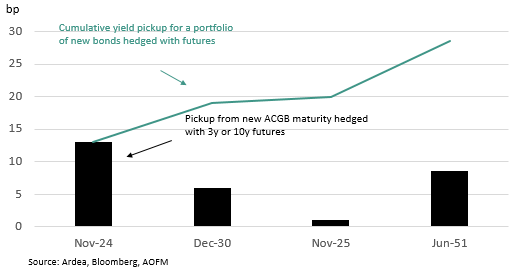
For example, between mid-April and mid-August the Australian government has issued four new sovereign bond lines (an historically fast pace of issuance). A simple strategy of purchasing these bonds at launch and selling the nearest liquid bond futures contract has delivered around 28bp of performance over four months. This total pickup is roughly equivalent to the overall trading range of the 10y Australian government bond yield (on closing levels) over the same period – which implies an investor would have to possess superior market timing skills to match the simpler strategy of buying (futures-hedged) new issues.
Chart 9: Performance of new Australian government bonds hedged with futures (mid-April to mid-August 2020)
3) Bonds versus derivatives
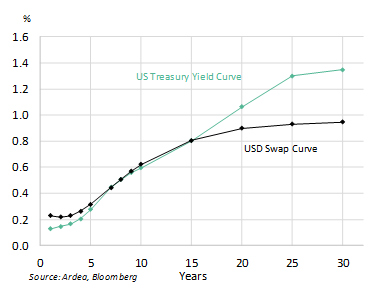
These trades capture pricing inconsistencies between government bonds and closely related derivatives such as swaps and futures. Recently, the outlook for central bank policy rates and rising bond supply is leading to many opportunities between government bonds and both swaps and futures. Government bonds are now often trading particularly cheap to swap and futures in parts of the curve where the central bank is not active compared with rich valuations in parts of the curve where the central bank is active. Even in the highly liquid US Treasury market, spreads between yields, swaps and bond futures exhibit volatility and relative value distortions. As Chart 10 shows, the pickup for owning bonds relative to swaps is most significant at the long end. While these spreads can trend or regime shift, trades can be structured to minimise such exposure and isolate specific bond mispricings.
Chart 10: US Treasury vs USD swap curves
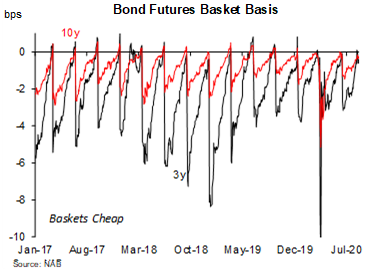
Another example of a trade capturing relative value in bonds versus derivatives, but with (normally) more constrained volatility, is a bond versus futures basis trade. There are variations of this type of trade across the world. In Australia for example, the settlement of each government bond futures contract reflects the average of yields for futures “basket” bonds at the time of settlement. The preferences and flows of investors typically mean that futures contracts trade more expensive (lower yields) than physical bonds during the life of the futures contract (each three months). But at expiry, the value of the futures contract is tied to the physical bonds. There is an arbitrage or “basket” trade available which involves buying those physical bonds and selling the underlying futures contracts before expiry. Chart 11 shows this gap between futures and physical bonds continues to exist in a lower yield world and in fact moved significantly wider at the height of the COVID crisis.
Chart 11: Bond versus futures basket basis – Australian government bonds
4) Cross-currency swaps and JGB repacks
Since 2008, cross currency basis spreads have become more volatile, due to a range of forces, including: regulation, mandate restrictions, liquidity, structural changes in bank funding models and issuance patterns. Central bank policy tends to have a second-round impact on cross currency basis whereas issuance and investor flows, both actual and speculated, are bigger movers of spreads. A lower rate world with more aggressive central bank policy won’t eliminate the basis and can continue to provide trading opportunities (see this BIS research note for more detail on why cross-currency basis spreads exist).
A recent example is the changing shape of the AUD/USD cross currency basis curve. Chart 12 shows that after significant volatility in March, there has been a steepening of the basis curve – shorter-term basis spreads fell, while longer term basis spreads lifted. This reflects the shorter-term spreads falling further than the long end because of excess liquidity from QE, less bank issuance and some long-dated issuance from other Australian entities. The basis curve will likely continue to exhibit volatility independent of government bond yields.
Chart 12: AUD/USD Cross-Currency Basis Spreads
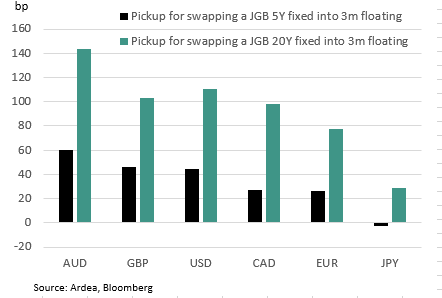
An investor can achieve a higher return by combining sovereign bonds and cross-currency swaps. One such trade is a JGB “repack” trade. This trade takes advantage of the fact that there is a cost for Japanese investors to hedge currency and interest rate risk in offshore assets and Australian banks and corporate bond issuers pay a cost to hedge offshore liabilities. The AUD-JPY 20y cross-currency spread is currently at levels that make swapping 20y JGBs into AUD attractive relative to shorter maturities. As Chart 13 shows, the pickup for swapping a 20y JGB into the AUD market is well above other peer markets.
Chart 13: Yield pickup for swapping 5y and 20y fixed rate JGBs into a 3m floating rate spread in various currencies
This material has been prepared by Ardea Investment Management Pty Limited (Ardea IM) (ABN 50 132 902 722, AFSL 329 828). It is general information only and is not intended to provide you with financial advice or take into account your objectives, financial situation or needs. To the extent permitted by law, no liability is accepted for any loss or damage as a result of any reliance on this information. Any projections are based on assumptions which we believe are reasonable, but are subject to change and should not be relied upon. Past performance is not a reliable indicator of future performance. Neither any particular rate of return nor capital invested are guaranteed.