

All Models Are Wrong – But Some Might Be OK
A Summary for Investment Professionals of Ryan, Gan and Warren (2025)
Synopsis
What if your most sophisticated model is wrong, and nobody knows it?
A model can be carefully constructed, supported by enormous amounts of data and seems to produce highly precise results. And yet it can still fundamentally misrepresent the relationship it is trying to capture. More data and more advanced techniques can make the wrong answer look more convincing without necessarily solving the core problem of the wrong model being fit in the first place. For decision-makers, the message is simple: ask more questions. What does the model assume? What else could be true? And what happens if the model is wrong?
1. Introduction
Financial models underpin almost every important investment decision, from how portfolios are constructed to how risk is measured. But models can look more reliable than they really are. A primary danger – and one that is often overlooked – is not that the wrong variables have been included or that the estimates are imprecise. Rather, it is that the model may be looking for the wrong kind of relationship in the first place. A simple example may help. Suppose we estimate the correlation between bonds and equities and come up with an equation like this:
Bond-Equity Correlation = 0.2 + 0.05 × Inflation − 0.03 × Economic Growth 1
Most practitioners immediately recognise two sources of uncertainty:
- We may have included the wrong variables. Perhaps inflation and growth matter, perhaps other variables. Perhaps interest rates matter instead of inflation. Perhaps both matter.
- Even if we choose the right variables, the coefficients are only estimates and may be inaccurate. Should the inflation coefficient be 0.10 instead of 0.05? Or zero?
These forms of uncertainty are well recognised, and a substantial academic literature has developed techniques to address them. Most of the techniques used to address these two forms of uncertainty boil down to either averaging over many possible models or accessing a larger dataset (via simulating or collecting more data). These techniques focus on determining whether the variables included in the model are appropriate and whether the estimated coefficients are reliable. Ryan and Whiting (2017) and Roberts and Ryan (2014) provide examples.
However, these are not the only sources of uncertainty. We show that the assumed ‘shape of the relationship’ is of fundamental importance. The above model assumes a direct linear relationship: a common assumption made by analysts in applying regression analysis. This form is just one of a plethora of possibilities.
2. Three Sources of Uncertainly when Modelling
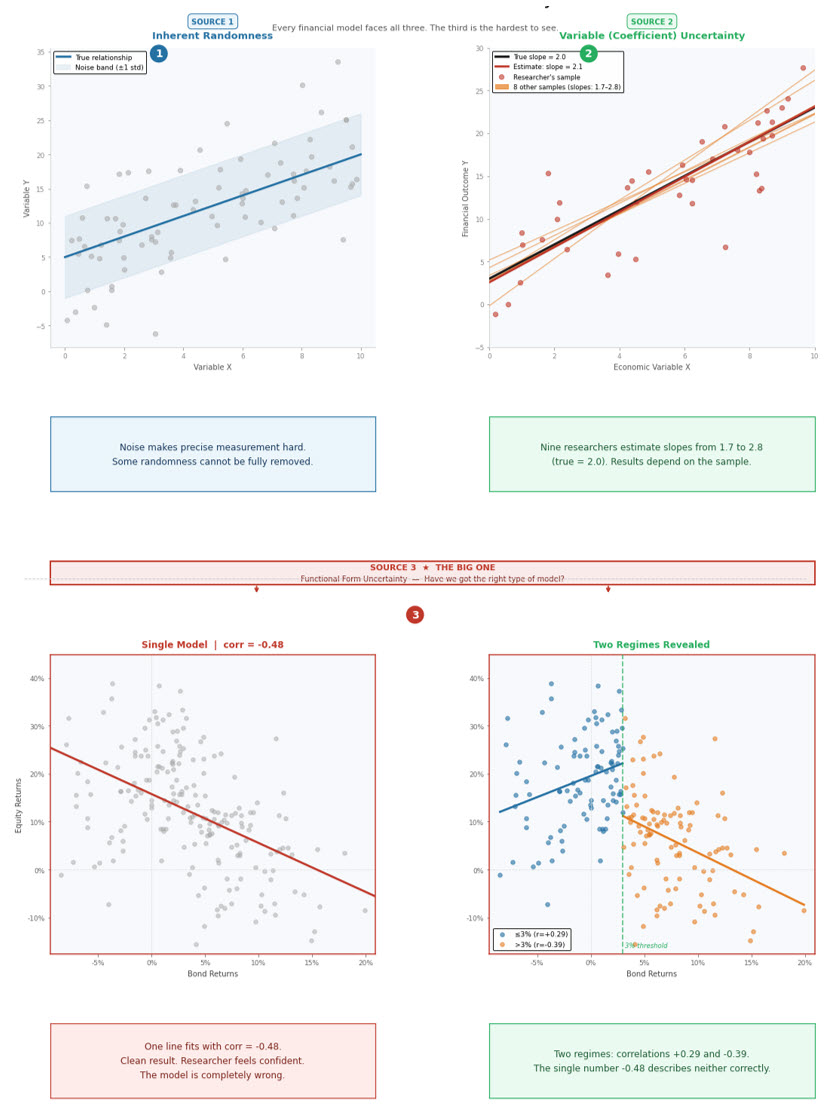
We unpack the three sources of uncertainty with reference to Figure 1, before circling back to discuss the implications for modellers and model users.
Figure 1: Three Sources of Model Uncertainty
2.1 The First Source: Inherent Randomness
Financial markets are turbulent. On any given day, thousands of factors influence prices. Most are essentially random noise that have no bearing on fundamental value, reflecting influences such as liquidity flows and emotional reactions. This noise is unavoidable. Even if you had a perfect model of how markets should work, real-world prices would deviate from it simply because of this background chaos2. Some of this uncertainty is fundamental to how markets work. It is not a flaw in the model.
Chart A in Figure 1 illustrates this first source of uncertainty. Here the right model is being fit and the estimated slope is correct, but the observed data is spread around the line. Typically this uncertainty is acknowledged by applying a confidence interval when using the model to predict potential outcomes, as reflected in the shaded area around the line.
2.2 The Second Source: Variable and Coefficient Uncertainty
Once you accept that noise exists, the next question is: which economic and market factors actually matter? And by how much?
This is where researchers often disagree. Consider our bond-equity example. One analyst might build a model that includes inflation, interest rates, and volatility. Another might add corporate earnings growth or demographic trends. A third might think credit spreads are crucial. This is not just about estimating the coefficients. Rather, it is about fundamentally different choices around which variables belong in the model at all.
And once you choose which variables to include, you must estimate how strongly each one matters. Does a 1% increase in inflation push bonds up or down? By how much? Different researchers may work from different datasets or use different time periods, and will accordingly reach different answers. Coefficient estimates can vary significantly based on:
- Which dataset you use: For instance, a model trained on the 1980s will estimate different coefficients than one trained on the 2010s.
- Which estimation method you use: Regression, machine learning, Bayesian methods and so on can each can produce different results.
Chart B in Figure 1 illustrates this source of uncertainty with regard to use of different samples drawn from the same underlying process. Each sample produces fitted lines with different slopes that are spread around the true slope. Needless to say, the scope for differing estimates would only be compounded under different sets of variables and estimation techniques.
Different variable, dataset, and method choices reflect legitimate academic disagreement, not incompetence. Reasonable people can study the same market facts and arrive at different conclusions about which variables matter and how strongly.
2.3 But there is a third source of uncertainty that is more fundamental still.
The third source is uncertainty about the shape of the relationship itself. In our paper, we call this ‘functional form uncertainty’ but it is also known as ‘model uncertainty’. Even if we knew the correct variables to estimate, we would still need to decide what shape the relationship takes and consequently what model to fit. Is it linear? Does it curve? Are there distinct regimes? This third source of uncertainty receives far less attention than the first two, yet it is arguably the most important.
A core problem is that the data alone often cannot tell us what model to fit. Unlike randomness, it cannot be reduced simply by collecting more data. Unlike variable and coefficient uncertainty, it cannot be readily resolved by identifying variables and estimating parameters more precisely with techniques such as bootstrapping, multi model averaging and machine learning.3
The challenge is that the true underlying model is never observed directly. We only observe noisy data generated by it. As a result, multiple competing model structures can often appear plausible when fitted to exactly the same data. This challenge is particularly acute in financial markets where the data is typically noisy, often limited in scope and can be highly subject to regime shifts.
Consider what a model actually is. Before you can estimate anything, you need some way of determining the shape of the relationship you are trying to estimate. Sometimes that shape is imposed explicitly. For instance, we might assume a straight line, a curve, or a ‘conditional’ relationship that changes with market conditions. More flexible techniques – such as machine learning – can search for structure within the data.
But none of these approaches can eliminate the core problem that any method still embodies assumptions about what kinds of patterns it can detect. As we show later, even techniques designed to uncover structure from the data can fail to identify the true relationship.
Ryan, Gan and Warren (2025) show that uncertainty about the underlying shape (i.e. functional form uncertainty) is the hardest source of model uncertainty to detect, the hardest to address and potentially the most consequential when it is wrong.
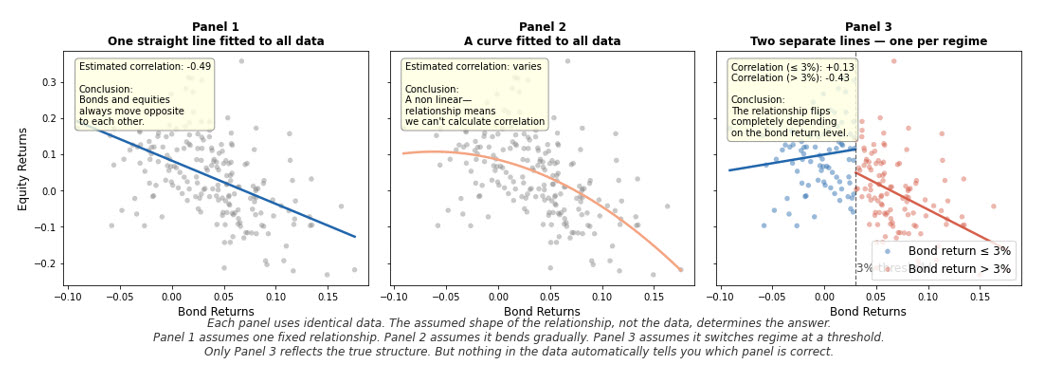
Figure 2 illustrates the problem. The charts show three different models being fitted the same data. Each model implies a different shape and produces a different answer. Each model may look defensible on its own terms. Analysts who assume a straight line, a curve or two separate regimes Each reaches completely different conclusions from exactly the same set of observations. Each may or may not realise that they have implicitly made a modelling choice. And a decision maker who uses the model output may be left unaware of the structural choice that produced the answer.
Figure 2: The same data. Three different shapes. Three different answers.
The remainder of this paper examines why functional form uncertainty is so difficult to identify, why many sophisticated modelling techniques fail to resolve it, and what practitioners can do to better account for it in decision making.
3. A Controlled Experiment: When the Wrong Model Looks Right
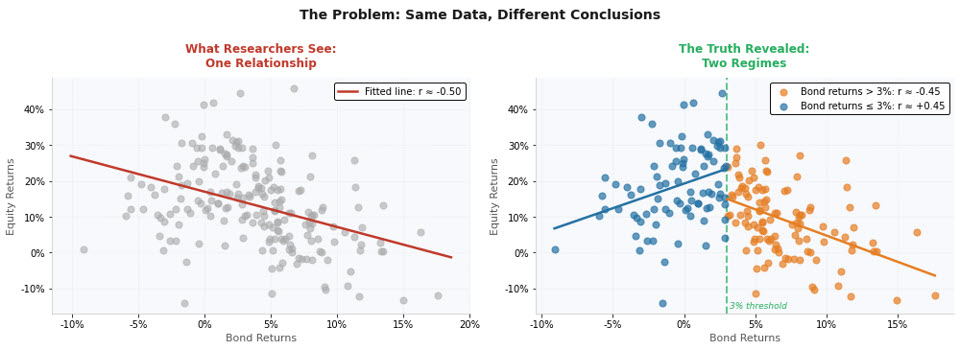
To show why functional form uncertainty is so problematic the paper runs a controlled experiment using simulated data where the true relationship is known in advance (something that is never available in practice). The underlying truth is simple. When bond returns exceed 3%, equities and bonds move in opposite directions (correlation ≈ −0.45). When bond returns are below 3%, equities and bonds move together (correlation ≈ +0.45). There are two distinct regimes.
Figure 3 presents the same set of 200 simulated data points with a simple linear model fitted on the left and the correct model fitted on the right. It is totally understandable how a researcher might fit the (incorrect) linear model on the left and think they have a captured the true relationship. Two hundred data points might seem like not very much but actually equates to 16-17 years of monthly data.
Figure 3: The True Structure
We now delve into the impacts when the amount of available data is varied.
3.1 What Happens with Limited Data
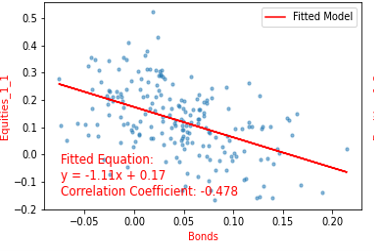
Figure 4 is one of nine independent samples of 200 observations we generated from the true process. Across all nine samples, fitting a simple straight line produces estimated correlations ranging from −0.642 to −0.478. Every sample pointed to the same conclusion: a negative correlation. This illustrates uncertainty over the slope coefficient. However the main concern remains obscured: the true relationship consists of two distinct regimes with opposite signs.
Figure 4: Correlation Coefficient from Fitting Linear Regression to Small Sample with Large Noise
3.2 More Data, Same Problem
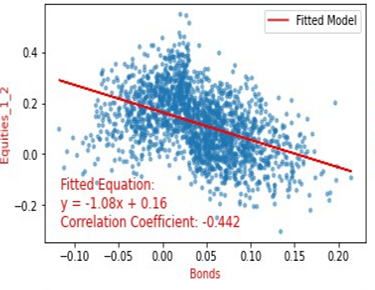
Figure 5 shows one of nine independent samples from the same experiment using 2,000 observations (equivalent to 167 years of monthly data). Across all nine samples, the estimated correlations narrow to between −0.478 and −0.422. The estimates appear more precise. Researchers feel more confident. But they are still wrong. The straight line still misses the true two-regime structure.
Figure 5: Correlation Coefficient from Fitting Linear Regression to Large Sample with Large Noise4
3.3 Only Visible Under Unrealistic Conditions
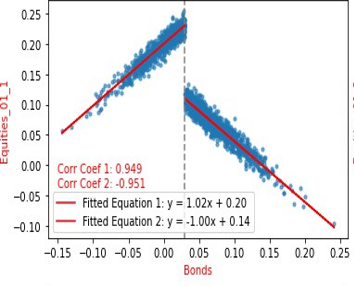
Figure 6 shows what happens when we reduce market noise to implausibly low levels of 1% volatility. Now the two regimes become visually obvious, allowing researchers to identify and fit separate models to each regime. Correlations are recovered of 0.940–0.950 in one regime and −0.957 to −0.951 in the other, which are close to the true values that were set. The problem is that this level of noise is entirely realistic. Volatility of 10%-plus would be more in accord with what is observed in markets.
Figure 6: Correlation Coefficients from Fitting Correct Model to Large Sample with Small Noise
3.4 The Key Insight
In the real world as reflected in Figures 4 and 5, the true model structure is invisible even with abundant data. You must already know to look for two regimes to find them. A linear regression model looks perfectly reasonable and produces confident estimates. But it is wrong.
4. Advanced Techniques Also Fail
Perhaps sophisticated clustering algorithms could detect the true structure? Unfortunately not. Even when we apply more complex machine learning techniques to the simulated data, the true model did not emerge under realistic conditions. Rather, a tendency emerged to either identify one regime or more regimes than actually exist, depend on the method applied.
We illustrate by applying DBSCAN,5 which is a clustering method designed to find groups of observations that sit close together. This provides a useful test of whether a more flexible method that is explicitly designed to find clusters in the data can detect the two regimes automatically.
4.1 Small Sample, Large Noise
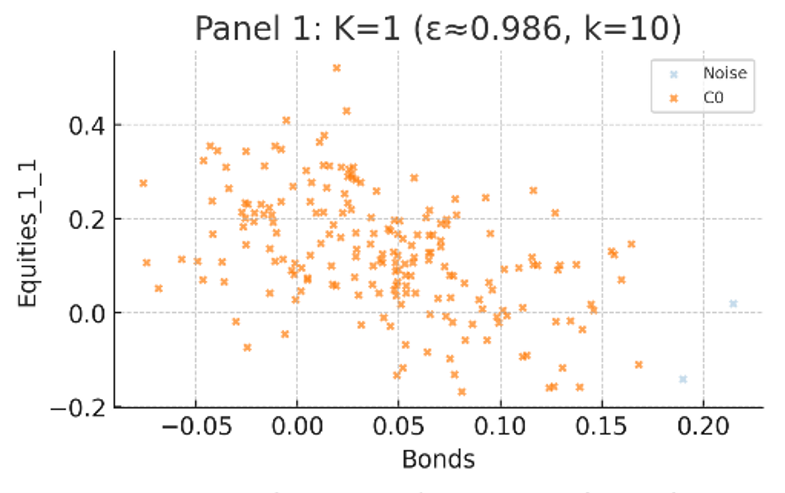
Applying DBSCAN to the 200-observation samples with realistic market noise still finds only one cluster (K=1 in Figure 7) across all nine simulations. It does not detect the two regimes, even though they exist in the true data
Figure 7: Clustering using DBSCAN Applied to Small Sample and Large Noise
4.2 Larger Sample, Still Large Noise
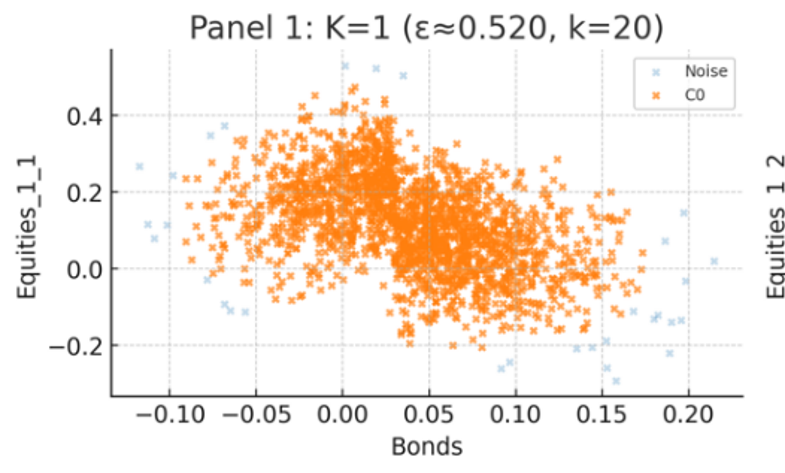
DBSCAN still finds only one cluster in every panel with 2,000 observations: see Figure 8 for an example. More data alone does not help. The noise is too large relative to the signal. The algorithm cannot build density differences sharp enough to separate the two regimes.
Figure 8: Clustering using DBSCAN Applied to Large Sample with Large Noise
4.3 Large Sample, Small Noise
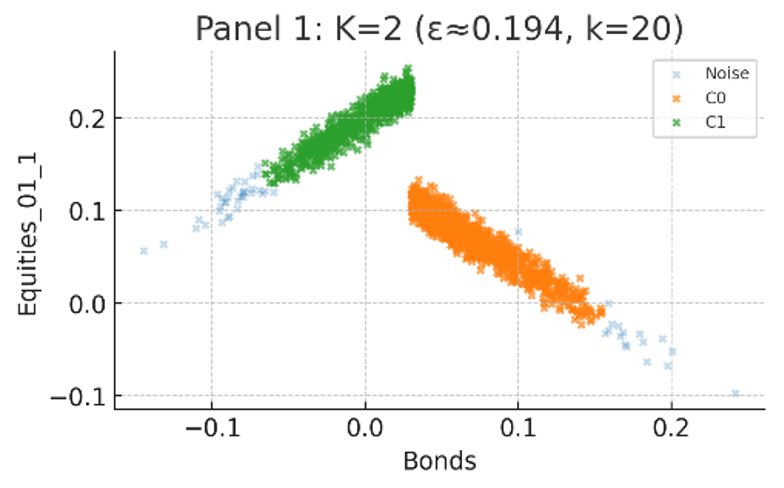
Only when noise is reduced to 1% does DBSCAN consistently find two clusters (see Figure 9). Even then, the captured patterns are not perfect with some genuine observations are labelled as ‘noise’. We emphasise that this example applies an unrealistically low noise level for financial data.
Figure 9: Clustering via DBSCAN Applied to Large Sample and Small Noise
4.4 Implications
Letting loose complex techniques on the data and allowing them to choose the model structure is no panacea. If a sophisticated clustering algorithm cannot find the true structure under realistic conditions, a simpler straight-line model certainly cannot. And if more advanced techniques cannot find the true relationship, neither can you – unless you already know what to look for.
5. What Should Practitioners Do?
Our aim is not to make every decision-maker a modeller so they can investigate for themself. Rather, it is to make model users more aware of the assumptions they are relying on and suggest what they might do about it. The answer is not to abandon models. It is to use them differently.
The first thing is to be humble. Acknowledge that models are based on assumptions, can be totally wrong and that placing faith in their output is dangerous. Selecting a single best model and presenting its output as ‘the answer’, without acknowledging the structural assumptions embedded within, creates a false sense of precision.
The problem can partly be addressed by building and applying a model to generate a range of plausible outcomes under different structural assumptions. This is more honest and ultimately more useful than showing a single confident number.
Another approach is to use multiple model structures, rather than searching for one correct model. Doing so is more likely to produce robust conclusions. An ensemble of models with different assumed shapes will almost certainly be wrong in some sense. But it is less likely to be wrong in one large way at a critical moment. And it increases awareness that choice of model matters.
Being explicit about structural assumptions is also important. For every model, the key question is what shape of relationship has been assumed, and what the answer would look like under a different shape.
Referencing theory can also be helpful. Basing the assumed relationship on solid theory can enhance reliability of a model and its outputs. The problem is that theory itself is often unresolved. Theory is helpful, but also no panacea.
Finally, model outputs should be treated as one input to a decision rather than the answer itself. Models are valuable tools for structuring thinking and measuring risk. Treating them as reliable forecasting machines, which evidence suggests they are not, creates unnecessary vulnerability.
6. Questions Worth Asking of Any Model
Before placing weight on any model output, practitioners might ask:
- What structural assumptions are embedded in this model, and why?
- How different would the answer be under a different assumed structure? If the structural assumptions are wrong, how bad could the consequences be?
- Has the model been tested across genuinely different market regimes, or only calibrated to one historical period?
- Do you get a vastly different model using a different technique?
Without being able to answer these questions satisfactorily, applying a model is dangerous and the outputs should be afforded considerably less weight than suggested by superficial precision.
7. The Bottom Line
All models are wrong. The question is whether they are wrong in ways that really matter for decision making.
The finding that functional form uncertainty persists despite applying many and varied techniques is not a criticism of those techniques individually. It is a statement about the fundamental limits of what any technique can achieve when the true structure of financial relationships is unknown.
Practitioners who build that uncertainty into their frameworks and processes rather than assuming it away will make better decisions over time. The finance industry would benefit from less faith in single-model precision, and more transparency about the assumptions that are unavoidably made when modelling data.
Learn More?
The full paper has been published in The Journal of Investment Strategies. Explore the complete research and findings via the link below.
1 Arbitrary coefficients and variables
2 You can reduce this noise by averaging over longer periods or by using larger datasets, but you cannot eliminate it. And this also may introduce the risk of a regime shift. A researcher with 20 years of data will still face randomness plus the risk of structural changes underpinning the data. Having access to 50 years of data does not get rid of the randomness, while the potential for structural change is heightened.
3 See the full paper for examples of these techniques. Also, if you have assumed the wrong structure for the model, these techniques won’t help much anyway.
4 Some readers have argued that they could spot the clustering. But remember that you would not have access to 9 versions of your sample data, and you would not know in advance that there are two regimes.
5 DBSCAN is an algorithm that searches data for natural groupings or clusters. Rather than the researcher deciding in advance how many groups exist, DBSCAN looks at the data and asks: which points sit close together? It treats isolated points as noise. In this case, we used DBSCAN hoping it would automatically discover the two regimes (bond returns above 3% and below 3%) without being told they exist. It failed to do so under realistic market conditions.
References
Roberts, D., and Ryan, L. (2014). Evidence of speculation in world oil prices. Australian Journal of Management 40(4), 630–651 (https://doi.org/10.1177/0312896214534150).
Ryan, L., and Whiting, B. (2017). Multi-model forecasts of the West Texas Intermediate crude oil spot price. Journal of Forecasting 36(4), 395–406 (https://doi.org/10.1002/for.2440).
Ryan, L., Gan, B., & Warren, G. J. (2025). All models are wrong. Some might be OK! The Journal of Investment Strategies, 15(1). https://doi.org/10.21314/JOIS.2026.003
Important Information
This material has been prepared by Ardea Investment Management Pty Limited (Ardea) (ABN 50 132 902 722). Ardea is the holder of an Australian financial services licence AFSL 329 828 and is regulated under the laws of Australia.This document does not relate to any financial or investment product or service and does not constitute or form part of any offer to sell, or any solicitation of any offer to subscribe or interests and the information provided is intended to be general in nature only. This should not form the basis of, or be relied upon for the purpose of, any investment decision. This document is not available to retail investors as defined under local laws.This document has been prepared without taking into account any person’s objectives, financial situation or needs. Any person receiving the information in this document should consider the appropriateness of the information, in light of their own objectives, financial situation or needs before acting.This document is provided to you on the basis that it should not be relied upon for any purpose other than information and discussion. The document has not been independently verified. No reliance may be placed for any purpose on the document or its accuracy, fairness, correctness or completeness. Neither Ardea nor any of its related bodies corporates, associates and employees shall have any liability whatsoever (in negligence or otherwise) for any loss howsoever arising from any use of the document or otherwise in connection with the presentation.