
Corporate Bonds – More Risk for Less Return
Key points
- Credit spreads over government bonds should compensate investors not just for default risk but also for other risks such as illiquidity
- Sacrificing liquidity in return for additional yield can be attractive if the compensation is sufficient and the time horizon of capital is appropriate
- But corporate bond markets are currently not providing sufficient compensation for growing illiquidity risk
- Corporate bond liquidity has become structurally impaired due to constraints on the bank balance sheets that are essential to facilitate trading activity
- At the same time, companies have taken advantage of record low financing rates to keep issuing more bonds, resulting in trading volumes relative to market size dropping below the 2008 financial crisis levels
- This is happening at a time when credit valuations are already rich and there is growing evidence of top-of-the cycle behaviour, such as investors buying a negative yield bond from a company rated just 2 notches above junk
- Additionally, rising interest rates combined with meagre credit spreads are starting to trigger fund flows out of credit beta products (junk bond ETF’s in the US just had their largest quarter of redemptions on record)
- As the early movers soak up what little liquidity is left, investors who had been reaching for yield in credit may be unpleasantly surprised by how illiquid corporate bond markets have become when they seek the exit… and with credit spreads at current levels you’re hardly being paid to take that risk
- Fortunately, fixed income offers a broad range of alternative return sources that can deliver attractive returns without resorting to credit risk, while still retaining a defensive risk profile.
Poor risk compensation
Credit spreads represent the extra yield investors receive for holding bonds issued by corporates, that typically have higher default risk than government bonds. However, they do not compensate for default risk alone.
In fact, it is well established in academic literature and market experience that default risk is not the major driver of investment grade (IG) credit returns and historical data shows that IG credit spreads consistently over-compensate relative to actual default losses.
However, this excess compensation is not free money. Rather it can be thought of as a credit risk premium that compensates investors for the other risks, beyond default risk, that they are exposed to. These other risks are often more important drivers of credit spreads than default risk.
Of these other risks, an important component is illiquidity risk – the risk that a credit investor is unable to sell a bond holding in a timely manner, without incurring punitive costs. Even long-term investors value liquidity, in order to maintain flexibility of asset allocation and that desire is often highest at times of market stress, when liquidity is most tested.
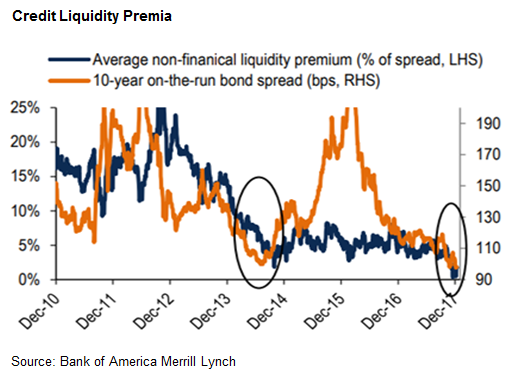
It’s generally underappreciated just how much corporate bond trading liquidity has deteriorated and this is happening at a time when the compensation for taking this liquidity risk has declined to historic lows.
Sacrificing liquidity in return for additional yield can be an attractive source of excess return if the compensation for illiquidity risk is attractive and the investor has the right time horizon of capital.
Currently, corporate bond markets are not offering attractive compensation for illiquidity and a growing segment of the market (e.g. corporate bond ETF’s) may not have the right time horizon of capital.
With credit spreads back near historic tights, corporate bond investors are now left taking more liquidity and credit risk for less return, as the charts adjacent show.
Less compensation for liquidity risk
Less compensation for default risk
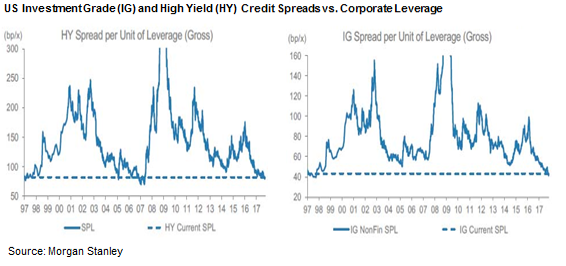
Parts of the global credit market are now barely compensating for default risk, let alone offering an additional risk premium for illiquidity.
For example, in November 2017 a BBB rated French company (Veolia Environment) priced a three year bond at a negative yield of -0.026%.
You read that correctly, a company rated just two notches above junk was being paid by investors to borrow money from them.
This was quite a result from the company’s perspective, given it doesn’t have the strongest of balance sheets;
“We assess Veolia’s risk profile as significant, given the group’s material debt”
Credit rating agency S&P, 2nd Jun 2017
and the company was happy to publicise this;
“Veolia has issued a 500 million 3-year EUR bond (maturity November 2020) with a negative yield of -0.026 %, which is a first for a BBB issuer.
The transaction was very positively welcomed by the investors, which led to an oversubscription ratio over 4.
Thanks to this strong demand, Veolia managed to issue the bond with a spread against swap rate of 5 basis points, which is the tightest spread ever achieved for a 3-year fixed-rate EUR Corporate bond.”
Veolia press release, 16th Nov 2017
but some investors were less gracious;
“Sacré BBB-leu!
Yesterday a Parisian BBB-rated company (i.e., quasi junk) issued $500 million in three-year notes yielding -0.026%.
We have been peppered with so many absurdities, nothing seems absurd anymore, although you can be sure when folks look back at this period, they will wonder, “What were they thinking?” and the list of examples will be quite long.”
European credit investor
In the high yield (HY) space, where default risk is material, the yield on the Bloomberg Barclays Pan-European High Yield bond index declined to a record low 3% in late 2017. This decline in yield was partly driven by tightening credit spreads and partly by abnormally low EU Government bond yields.
To put a 3% yield in perspective, Moody’s trailing EU HY 12 month realised default rate is 2.78% and the long term average is 3.79%. Assuming a 40% recovery rate, this translates into realised losses of 1.67% and 2.27% respectively.
Basically, a 3% yield leaves very little margin for error in credit selection or timing the credit cycle, let alone a risk premium buffer.
Added to this, the investor protections offered in high yield bond documentation has been consistently watered down over the past few years.
Corporate bond liquidity is impaired
While credit spreads are now mostly back to pre-GFC levels, corporate bond trading liquidity has got a lot worse.
As the volume of bonds outstanding has significantly increased since 2008, relative trading volumes have decreased and this impairment in liquidity is structural in nature as it has been caused by regulatory constraints on bank balance sheets.
Recall that the corporate bond market is not exchange traded and is therefore completely reliant on bank intermediaries (market makers) to facilitate risk transfer.
Regulation has simultaneously decreased the ability of bank balance sheets to hold bond inventories and also increased their cost of capital, leading to structural impairment of market makers’ ability to supply liquidity.
The New York Federal Reserve Bank estimates that banks currently only hold about 20% of their pre-crisis bond inventories.
Simply looking at average bid-offer spreads of actual trades that have taken place, as most liquidity studies do, fails to differentiate between situations where an investor needs to trade and therefore needs liquidity vs. where an investor’s interest happens to suit a position that a dealer already has and is therefore actually providing liquidity.
The Washington Federal Reserve published a study on corporate bond liquidity that tries to capture this important nuance.
Their study found that in situations where investors truly need liquidity, they are paying 35-50% higher bid/offer spreads compared to the pre-financial crisis period and it is worth noting this has occurred against a very favourable backdrop of rallying credit markets.
Put another way, liquidity studies based on transaction data only cover the trades that actually took place and ignore those that never happened. It’s the latter that are most relevant when assessing the true liquidity of a market because it’s the trades that fail to execute that evidence poor liquidity.
Unfortunately, evidence of the growing number of corporate bond trades that aren’t happening due to declining liquidity is not readily available, beyond anecdotal information such as this;
- the head of any corporate bond trading desk at a bank will tell you their risk limits have been cut and their ability to facilitate client transactions has materially reduced compared to the pre-GFC era
- BlackRock estimates that less than 20% of investment grade corporate bonds in the US trade daily, and the sizes of those trades has considerably reduced
- 71% of institutions participating in Greenwich Associates 2016 US Bond ETF Study said the trading of securities has become more difficult in the past three years; 60% of study participants reported greater difficulty in completing large-sized bond trades in 2016
- of 400+ credit investors interviewed by Greenwich Associates in the U.S. and Europe in 2016, over 80% cited reduced market liquidity as impacting their ability to implement investment strategies.
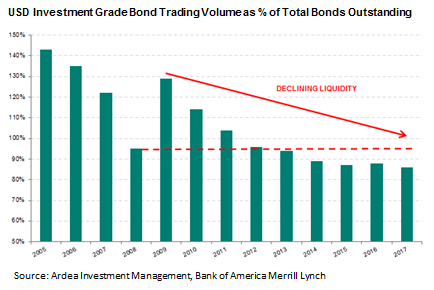
Perhaps one hard data metric which captures this dynamic calculates bond trading volumes as a proportion of the total market size.
If liquidity was consistent, trading volumes should rise as the market grows such that this proportion remains constant.
The adjacent chart shows this has clearly not been the case.
Trading volumes in US investment grade corporate bonds, which are the most liquid segment of corporate bond markets, as a percentage of total bonds outstanding has declined to lower levels than during the financial crisis in 2008.
Declining corporate bond liquidity
Impaired liquidity + tight credit spreads + rising interest rates = ???
To date, this impairment of liquidity hasn’t affected credit market performance because fund inflows have been running at record levels.
So, what could trigger an outflow from corporate bond markets that would really test liquidity and certainly cause a material widening of credit spreads?
A turn in the credit cycle is the obvious catalyst but credit fundamentals are generally still OK, albeit weakening. A more imminent and less obvious catalyst could simply be rising interest rates.
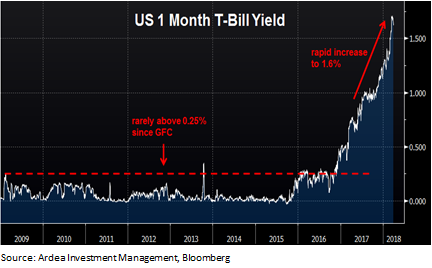
As of March quarter end, the yield on 1 month US Treasury Bills reached 1.62%. Having minimal credit or interest rate risk (the occasional government shutdown drama aside), this is close to what most investors would consider a risk free rate of return.
As the following chart shows, higher risk free rates are a big shift from what investors had become accustomed to in the post financial crisis world, with almost half that move higher taking place in just the past 6 months.
For investors with absolute yield targets, as risk-free rates rise, their incentive to keep reaching for yield in higher risk assets falls, which then triggers selling of higher yielding assets as the ‘reach for yield’ dynamic reverses.
Rising risk free rates
It’s no secret that the ultra-loose monetary policy adopted by central banks since the financial crisis has triggered an unprecedented reach for yield, which has resulted in significant yield compression between risky assets and risk-free benchmarks.
Put another way, investors have been forced to accept less and less return in exchange for taking risk and the following chart illustrates how the yield pick-up from switching into higher risk credit assets is disappearing.
Reach for yield delivering less
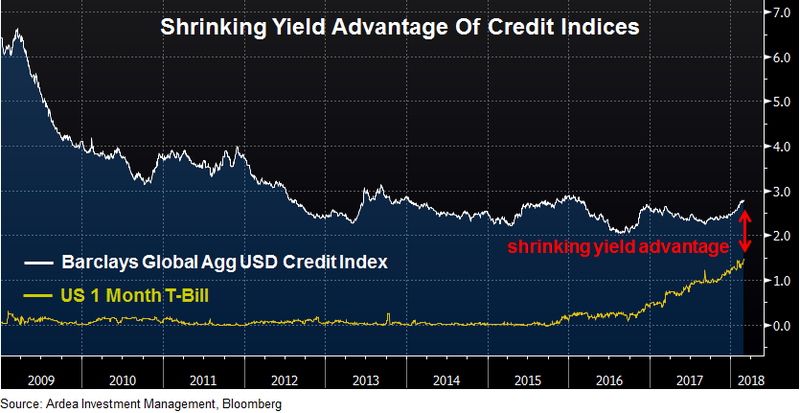
The chart compares the yield on 1-month US T-Bills to the Barclays Global Aggregate USD Credit Index.
While the former has minimal interest rate risk, the latter comes with 6.5 years of interest rate duration, which means for every 1% increase in interest rates the index would incur a 6.5% capital loss.
While the former has minimal credit risk, the latter includes securities with material credit risk, including a 12-year junk rated bond issued by Russia in its top 15 holdings.
The yield differential between the two has decreased to just 1.17%.
So, reaching out the risk spectrum is yielding less and less in return, and begs the question of whether this will trigger large outflows from credit beta products.
Even modest outflows are straining liquidity
There is already some evidence that outflows from credit are picking up.
US high yield credit has now had eight consecutive weeks of outflow, while US investment grade credit recently recorded the first net outflow in over a year. US junk bond ETF’s had their largest net redemption on record.
But overall the outflows from credit as a whole remain very modest.
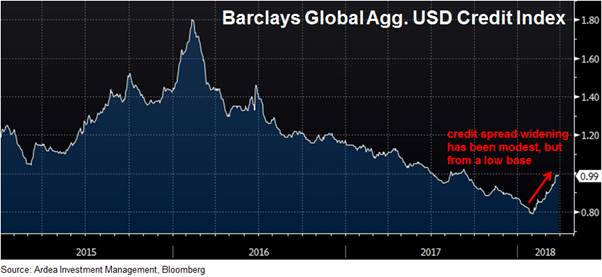
Nonetheless, over the first quarter of this year corporate bonds experienced their worst spread widening since the China growth scare in early 2016.
While the magnitude of the move was smaller than in 2016 it’s coming off a lower base, meaning there is now a smaller spread cushion to buffer this type of volatility.
A small taste of credit re-pricing
Perhaps this is just a temporary demand/supply imbalance, but if outflows from credit were to gain momentum it’s unclear how credit markets, already suffering from structurally impaired liquidity, will handle it.
Here are some actual comments, direct from those who were facilitating trading liquidity, during this most recent period of only very modest re-pricing;
“…credit pretty weak into the close, as short-end lists surfaced for most of the session. There’s also been a large proportion of 30-year risk for sale. “No one’s putting a bid on paper,” says trader, as some short bonds have widened 12bp since Monday”
March 23rd
“… optically a steadier night, but digging deeper reveals continued problems in markets. In particular, bid side liquidity is now often zero (order only), particularly in off the run bonds.”
March 29th
As the early movers soak up what little liquidity is left, investors who had been reaching for yield in credit and now seeking the exit may be unpleasantly surprised at just how illiquid corporate bond markets have become.
With credit spreads at current levels you’re hardly being paid to take that risk.
Fortunately, fixed income offers a broad range of alternative return sources that can deliver attractive returns without resorting to credit risk, while still retaining a defensive risk profile.