
All I Want for Christmas is a Positive Yield
Download Research Note: All I Want for Christmas is a Positive Yield (PDF)
- In December, the Australian Government sold negative yielding nominal debt for the first time.
- Central bank liquidity and cross-currency swap dynamics can drive negative short-term yields even with positive official policy rates.
- The global pile of negative yielding debt hit a record high level this month, amid another increase in ECB QE.
- Unlike zero or negative interest rate cash balances, negative yielding bonds have still delivered investors positive returns via capital gains, but the outlook is arguably asymmetric and unfavourable at current levels.
- We discuss how the massive volume of central bank liquidity and prospects for a rebound in the global economy in 2021 are underpinning the large divergence between equities and bond yields.
Australia paid to borrow
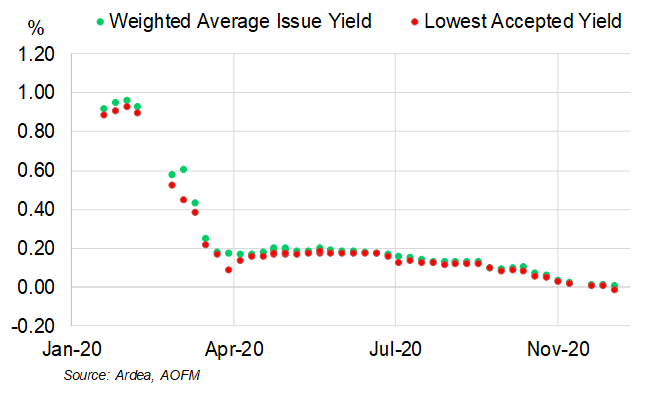
In December, for the first time ever, Australia sold nominal debt at a negative yield. A small allocation within a 3 month T-note tender cleared at a yield of -1bp. The weighted average yield for the whole tender was slightly higher at +1bp. Yields across the rest of the government curve continue to trade at positive – albeit historically low – yield levels. The negative yield tender allocation is a dislocation caused by large central bank liquidity and cross-market forces.
Chart 1: Yields on 3 and 4 month Australian Commonwealth Government T-Note tenders
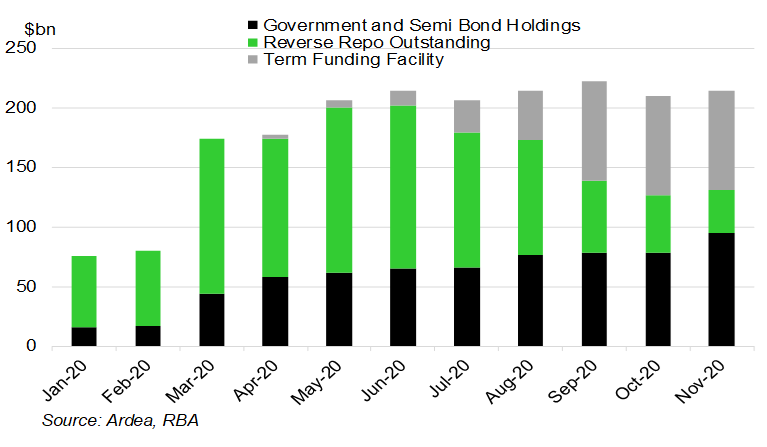
The RBA does not have a negative cash rate policy and the swap market is not pricing a negative cash rate into the forward curve. The reason for the negative T-note yield reflects the supply/demand forces impacting the cash market, particularly the huge volume of liquidity flowing from the RBA’s unconventional monetary policies. (We discussed in a note last month the implications of the latest policy changes for investors). Chart 2 shows the large volume of liquidity added via unconventional policy measures since the onset of COVID in March. While emergency direct liquidity operations – via repo (and FX forwards) – have been dramatically scaled back, the aggregate volume of extra cash flowing through the system via the Term Funding Facility (cheap loans to banks) and bond purchases has grown to over $200bn.
Chart 2: RBA extraordinary monetary policy operations
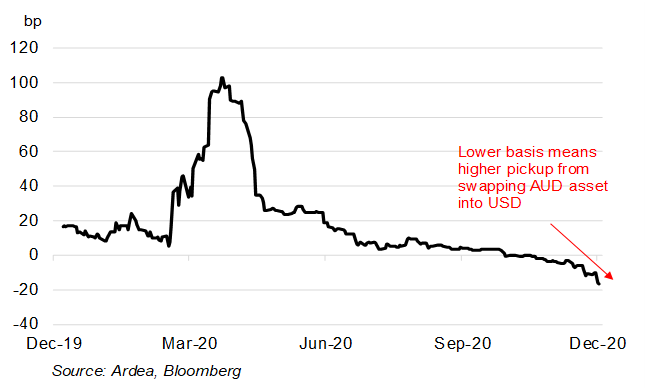
One upshot of recent liquidity dynamics is that an investor could achieve a positive return above an equivalent USD asset by cross-currency swapping a negative yielding AUD T-note into USD. Cross-currency swaps are a type of “hedging market” and the spread represents the cost of FX hedging over some period of time, such as 3 months (for more information see this note). Because Australian banks historically hedge large amounts of offshore liabilities, the spread is usually positive. But now there is lots of extra AUD cash floating around the system thanks to RBA policy and there is extra demand for USD around year-end (this seasonality occurs because of technical factors that drive market behaviour). The net result is the AUD/USD cross-currency basis has turned negative at shorter tenors. This allows a USD-based investor to lend USD in exchange for AUD and effectively convert a negative yielding AUD T-note into a positive return above an equivalent USD rate. Alternatively, if the sharp appreciation in the spot AUD/USD since early November continues, a USD-based investor might well achieve a positive total return without hedging FX risk. In either case, it pays to take a global perspective on any asset price – negative yielding T-notes are no different.
Chart 3: 3 month AUD/USD cross-currency basis
Negative yielding debt pile reaches record high amid increase in ECB QE
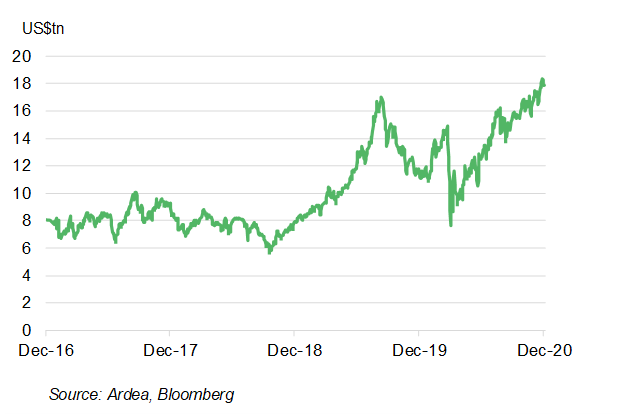
Australia’s brief negative yield experience in a T-note tender reflects money market liquidity conditions, which may not drag down other tenors or instruments into negative territory. In contrast, other central banks, particularly the ECB and BoJ, have sustained negative policy rates and QE targeting negative yielding bonds over the last few years. The total global pile of negative yielding debt reached a new record high of US$18tn in December amid aggressive new ECB stimulus measures.
Chart 4: The market value of the global pool of negative yielding debt
At their December meeting, the ECB announced plans for a further €500bn of new bond purchases and an extension of the QE programme until March 2022. The ECB’s aggregate stimulus for 2020 has now reached over €3tn. A few key implications of the latest round of ECB policy easing:
- European bonds are resilient to good vaccine news. Euro sovereign bond markets have sustained low yields or seen new record low yield levels over the last two months, even in the face of very positive vaccine news which helped propel the EuroStoxx 600 to a record monthly gain of 14% in November.
- QE viewed as critical to the recovery. The ECB expects to continue buying bonds through 2021 even as growth is anticipated to rebound sharply with vaccinations rolled out across populations. Elevated unemployment and deflation fears remain front of mind.
- ECB bond demand set to exceed supply. Market participants expect ECB QE to exceed the net new supply of bonds being issued in 2021 – an extraordinary outlook considering the record volumes of fiscal stimulus being thrown at economies.
- More negative yielding peripheral debt. Spanish and Portuguese 10y bond yields traded at negative yields for the first time in December – a far cry from the over 7% and 14% respective peaks seen through the sovereign debt crisis earlier this decade.
Where to from here?
The Australian market showed in December that it is possible to see very small parts of non-negative policy rate markets trade at a negative yield. The much bigger global story is the massive pile of negative yielding bonds, which reflect negative rate policies and QE from the ECB and other large central banks.
What do negative yields mean for bond investors? A negative capital return is assured if what negative yielding bond markets are pricing into forward curves come into fruition. But yield curves are rarely static. History has shown that negative yielding bonds can deliver positive returns if these yields turn even more negative after an investor purchases them. Economic conditions, demand for safe-haven bonds or further central bank policy easing could all deliver a positive return from a negative yielding bond investment. A case in point – the Bloomberg index of negative yielding bonds has returned +8.8% over the last year, compared to 7.1% for a high yield index. A negative yield bond investment might also outperform a zero rate cash investment or very slightly negative T-bill, like our earlier Australian example. With a T-note or cash account, the capital gain potential is generally very limited because of very low or non-existent price volatility. (For more information about fixed income return generation, see here. For further discussion on negative rates, see here).
Of course, yields could go up and deliver an investor in a negative yielding bond a loss. Indeed, many investors regard the current outlook for sovereign bonds as asymmetric at current extreme low yield levels. Forecasts are mostly for a sell-off in bonds next year, although only modest moves are projected. The low and negative yields on offer in sovereign bonds are prompting a broad reach for yield trade into higher yield credit and equities. A recovery narrative is dominating price action, as the extent of recent divergence between stocks and bond yields illustrates.
Chart 5: Equities vs bond yields
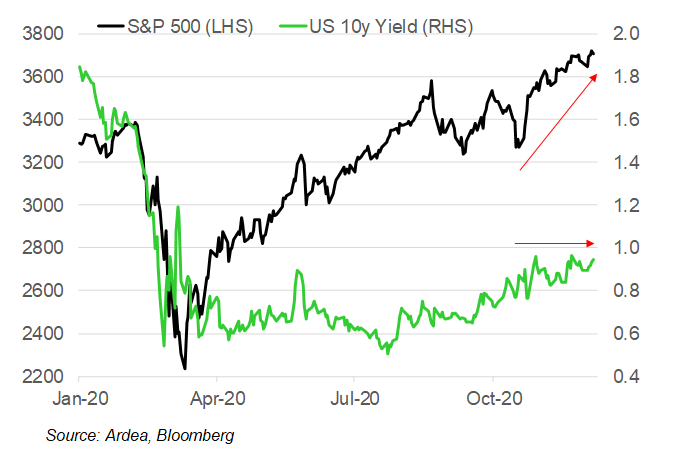
Underpinning the risk asset and bond yield divergence are assumptions about what 2021 holds for the global economy. We outline a few of the key themes.
- Markets anticipate a remarkable turnaround in growth
2020 has seen the sharpest decline in global output in around 100 years by some estimates. The IMF expects global real GDP growth to finish the year down around 4.7%. For 2021, growth is forecast to rebound by 4.8%. Both the depth and speed of recovery in growth from the COVID recession stand in stark contrast with previous global recessions, such as in 2008.
There are big assumptions underlying bullish 2021 forecasts, especially around the effectiveness and pace of COVID vaccines, which are critical to economies reopening. There are plenty of risks to the positive consensus outlook, such as logistical problems, population aversion to vaccines or the virus mutating. The emergence or not of these risks will be critical for risk appetite and demand for safe-haven sovereign bonds in the coming months.
- Economic scars from COVID and low inflation
A strong prospective year-on-year rebound in GDP growth masks a lot of underlying weakness. Growth will remain well under the pre-COVID trend, while balance sheets and labour markets are generally not forecast to recover as quickly. International mobility will also be impacted for longer, which makes for a particularly difficult outlook in countries with higher dependence on tourism and immigration. This backdrop supports a low inflation consensus among economists. Even before COVID, many central banks were struggling to navigate structural forces driving a lower sensitivity of inflation to falling unemployment. These sorts of challenges haven’t gone away, even if markets are focusing more on the bounce in headline growth. This low inflation assumption could be challenged – a risk explored in more detail in this recent note.
- Central banks will maintain highly accommodative policies
Central banks have gone all-in with policy measures this year, having taken rates to their respective effective lower bounds. Expectations of a lift in official cash rates have been pushed beyond the next year across markets. The ECB and BoE recently increased QE, while the Fed and RBA have recently said they will need to see inflation at or above target before considering any policy tightening.
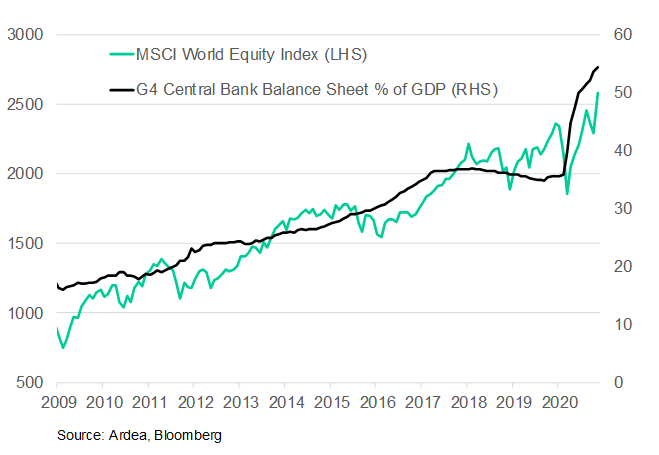
Balance sheet growth has exploded in 2020, by over $8tn among the largest central banks. The near-term outlook is for more of the same, which is providing all assets with a big boost. Longer term, there is a risk any prospective pull-back in support could shake this low yield and strong risk asset dynamic.
Chart 6: Massive central bank balance sheet growth has supported asset prices
- Fiscal policy support is a big potential swing factor
At the height of the global crisis in March, we wrote about the shift in market importance from monetary to fiscal policy (see here for more details). Governments have significantly supported economies in the wake of the massive drag from COVID shutdowns through a mix of direct payments to households and businesses and guarantee structures. The recession would undoubtedly be much more severe if aggressive action hadn’t been taken (some estimates put the contraction at as much as double what has been experienced).
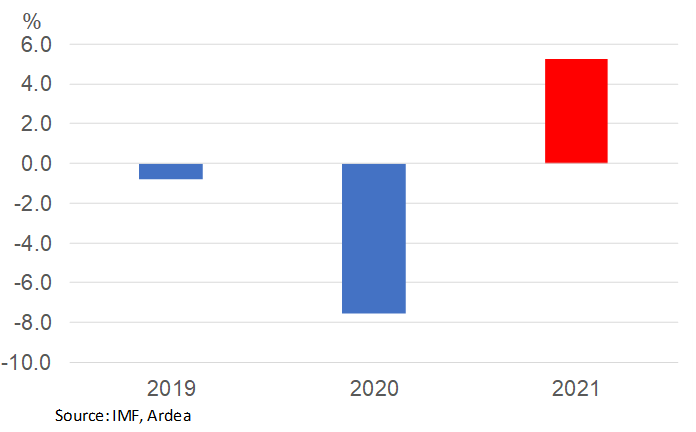
Through 2021, the prospects of economies re-opening also raise the risk of fiscal support being removed too early. Fiscal tightening through 2011 to 2015 hindered the recovery from the global financial crisis. The stakes this time around are massive and so is the risk of a policy mistake. Chart 7 shows the IMF’s estimate of a turn in the fiscal thrust next year if enacted policies across the world are allowed to roll-off. But the IMF also point out the ample room for upside surprises to growth if policies are extended.
Fiscal policy is especially critical for the bond market, where a massive rise in issuance in 2020 contributed to steepening pressure at the long end of yield curves (see here for a more detailed discussion). With deficits still massive, the volume of issuance will still be large in 2021 (even if incrementally it’s less than this year). Central bank purchases are set to eclipse issuance in some countries, but not others, while the distribution of purchases compared to issuance varies greatly across markets.
Chart 7: IMF estimate of change in structural fiscal balance (% of GDP)
This material has been prepared by Ardea Investment Management Pty Limited (Ardea IM) (ABN 50 132 902 722, AFSL 329 828). It is general information only and is not intended to provide you with financial advice or take into account your objectives, financial situation or needs. To the extent permitted by law, no liability is accepted for any loss or damage as a result of any reliance on this information. Any projections are based on assumptions which we believe are reasonable, but are subject to change and should not be relied upon. Past performance is not a reliable indicator of future performance. Neither any particular rate of return nor capital invested are guaranteed.