
Lies, Damned Lies and Correlations
(With apologies to Benjamin Disraeli via Mark Twain)
The carrot that alternative investment strategies often dangle in front of investors is the prospect of uncorrelated returns.
In an investing context, correlation is a commonly used measure of how returns from different investments move relative to one another. If the correlation is high, when one investment is incurring losses it’s likely the other will be too. If the correlation is very low, you would expect their returns to move independently of each other and if the correlation is negative, they would move in opposite directions.
By combining uncorrelated or negatively correlated investments in a portfolio you can potentially diversify away some risk, without disproportionately reducing returns.
The classic example would be the 60/40 balanced portfolio. It’s assumed that the 60% allocation to equities is negatively correlated to the 40% bond allocation, so when equities are down the bonds will generate gains to offset some of the equity losses and when equities are up, bonds are either stable or only incur small losses. This way your blended portfolio return is less volatile and you end up with higher average returns per unit of risk than if you held a 100% in equities.
In the same way this can be done with individual investments, it can also be done by combining uncorrelated funds.
While these ideas may be sound in principle, they ignore important details. For example, correlation tells you nothing about the underlying causal relationship between the returns you’re analysing and …. correlations do change.
It’s standard practice for researchers to download a fund’s monthly return history into a spreadsheet and calculate correlations with various market indices. While this is a useful starting point, without context on what the fund is actually doing, the resulting correlation numbers can be very misleading.
For example, the chart below shows a very high correlation between margarine consumption and the divorce rate in the US state of Maine.
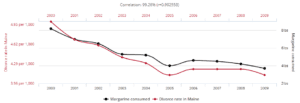
Source: tylervigen.com
Is it really the case that lower margarine consumption reduces divorce rates? Unlikely. This is either just a coincidence that occurred over the sample period or there is some other common factor that relates the two.
In the same way, when assessing the correlation of an investment strategy it’s important to understand the fundamental causal relationships between the fund’s investment strategy and broader markets. It’s also necessary to consider specific factors that might have influenced the relationship over the sample history you’re assessing and how that might change in the future.
For example, a high yield bond fund can exhibit low correlation to equities in benign market environments. This is because the returns are largely driven by carry (i.e. the interest earned from holding bonds), punctuated by occasional idiosyncratic defaults (i.e. company specific rather than related to broader markets) and will therefore be independent of the short term gyrations of stocks.
However, in a recession scenario high yield bond returns will become highly correlated with equities because there is a common causal relationship linking the two – the influence of broader economic conditions on the fortunes of individual companies. If economic conditions weaken significantly the profitability of most companies will be reduced, causing balance sheet stress and an increase in defaults. So it’s likely that the high yield bond market will incur losses just as equities are falling.
That causal relationship is hidden in benign environments but becomes dominant in times of economic stress. Unfortunately, it’s precisely in these times that investors look to uncorrelated investments to help dampen their losses.
Private debt investments can exhibit even lower correlations to equities in benign environments as they are not marked to market as readily as bonds are. But in periods of stress they can fall victim to the same causal factors and end up being highly correlated to equities on the downside.
Correlations can also change because the underlying causal relationships change. For example, government bonds and equities tend to be negatively correlated when inflation is low and stable. However, in periods where inflation accelerates quickly, forcing central banks to hike rates aggressively, both bonds and equities become positively correlated and incur losses together.
In the opposite vein, low volatility investment strategies that access return sources which are fundamentally unrelated to market direction may appear correlated in benign, positive trending markets simply because the return history happened to cover a period where they generated positive returns at the same time that markets happened to be going up.
However, in a stressed environment they diverge and become uncorrelated because their return sources have no strong causal relationship with broader markets and continue to generate positive low volatility returns even when equity markets fall. This is particularly true of strategies that include downside tail risk mitigating trades, which actually profit when broader markets fall but don’t do much in benign environments.
The challenge for investors is to dig deep enough to understand what the investment strategy is actually doing, what the causal links to other asset classes might be and how these might change in different market environments.