
The most important chart you’ve ignored
Having minimal credit or interest rate risk (rising debt levels and politics aside), the return offered by very short dated government bonds, referred to as Treasury Bills (T Bills), can be used as a proxy for a risk free rate of return.
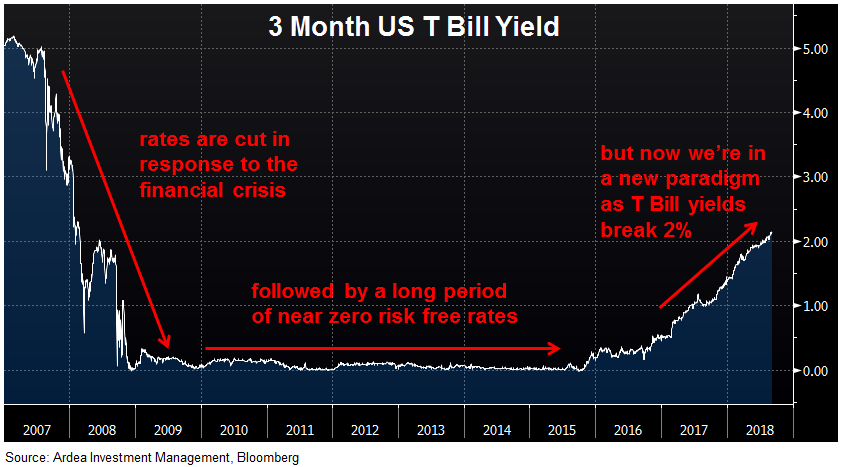
In response to the 2008 financial crisis central banks around the world cut interest rates and embarked on an unprecedented program of monetary stimulus. As a result, risk free rates around the world fell to zero and this had two related effects.
Firstly, risk free rates form the foundation from which discount rates are calculated. These discount rates are then used to value cash flows generated by assets ranging from bonds to stocks to real estate. All financial asset valuation is based on discount rates and as they fell, asset prices were pushed higher.
Secondly, as the rate of return (or yield) investors could get from lower risk assets fell in line with risk free rates, a great rotation of capital began that has lasted for the past ten years. A wall of money progressively moved up the risk spectrum, into riskier and riskier assets, in order to generate higher returns … the ‘reach for yield’.
In fixed income this manifested as capital rotating out of cash deposits and government bonds into progressively riskier credit securities.
This ten year paradigm is now shifting.
In July this year, the yield on a 3 month US T Bill broke above 2%. As the chart below shows, this is a big shift from what investors had become accustomed to in the post financial crisis world and more than half that move higher happened in just the past 10 months.
Why is this important?
Firstly, the discount rate applied to all financial asset valuations is rising and therefore, all else equal, asset prices should fall.
Secondly, when you can now get 2% from a 3 month T Bill or 2.6% from a 2 year US government bond, at a time when riskier assets are offering a much smaller yield pick-up than they used to, the drive to keep reaching for yield weakens.
The risk relative to reward proposition now looks much less appealing, which has implications for asset price valuations and volatility globally.
This doesn’t mean all capital flows suddenly reverse into lower risk assets.
Rather, it will be subtle at first, like water leaking out of a bath tub when the plug is removed. Initially you hardly notice but then it becomes increasingly obvious the water is running out.
We’re already starting to see the effects in some parts of financial markets.
Somewhat under the radar, US investment grade credit spreads have been widening consistently since the beginning of this year, and have now almost given up all of last year’s gains. This is not what you would normally expect at a time when economic growth is robust and default rates are very low. It’s happening because ‘reach for yield’ flows are weakening (refer to – ‘Investment Grade Credit Relative Value’ for details).
As an aside, this is relevant to something very topical in Australia right now … bank funding. Australian banks are heavily reliant on US debt markets for part of their funding. As credit spreads widen, funding becomes more expensive and eventually that flows through to their overall cost of funding.
More generally, as the ‘reach for yield’ dynamic gradually unwinds, expect asset price volatility to rise across all financial markets. Just as we’re now seeing in emerging markets.
Ardea Investment Management