
Yield curve inversion
Yield curve inversion … everyone has an opinion but does anyone really know?
Key Points
- falling bond yields globally and inversions across the US yield curve have some ‘expert’ forecasters panicking about an impending recession
- another group of ‘expert’ forecasters is saying this time is different because bond market signals are now distorted by structural factors
- in our view, yield curve shapes are driven by many interacting variables and can therefore be subject to a lot of noise, which makes them poor economic indicators
- the experts can debate endlessly about whether declining bond yields and inverted curves signal a future recession or not, but the unpleasant truth is that no one really knows
- what we do know is that low yields and flattening curves have already changed the risk vs. return characteristics of holding bonds, which has real consequences for portfolio construction
- when bond yields are already very low and yield curves are flat, using duration for defensive risk diversification or downside portfolio protection becomes an expensive form of portfolio insurance (refer – duration is now an expensive insurance policy)
Many ‘experts’, with diverging opinions
Bond markets, like the plumbing in your house, tend to only get attention when something goes wrong.
That’s what’s happening now as falling bond yields globally and inversions across the US yield curve (i.e. long dated bond yields dropping below short term rates) have some ‘expert’ forecasters panicking about a global economic growth slowdown and impending recession in the US.
Lower bond yields and inverted yield curves can be interpreted as a sign that bond markets expect rates in the future to drop lower than current levels as central banks are forced to cut interest rates in response to slowing economic growth.
Meanwhile, another group of ‘expert’ forecasters is saying this time is different because bond market signals are now distorted by structural factors such as the anchoring of inflation expectations and central bank bond buying, so yield curve inversion is not in fact a warning of impending economic doom.
Who turns out to be correct is anybody’s guess. Historically, yield curve inversions have preceded recessions, but the sample size is small and the time lag until can be years, making it a weak signal.
Additionally, there is no strong causal link between yield curve inversion and recession, other than it becoming harder for banks to profit from ‘maturity transformation’ (i.e. borrow short term to lend longer term at higher rates), which may have flow on effects to economic growth. But this is a weak link.
The fact that equally qualified ‘experts’ are drawing diametrically opposing conclusions from the same information tells you all you need to know … some things are just unknowable, so it’s futile trying to forecast them. (Refer – Why do you pay attention to financial forecasts?)
The forecasting crowd is fickle
In our view, trying to forecast these types of macroeconomic outcomes is not a reliable source of returns given all the variables, subjective assumptions and feedback loops involved.
Remember it was only a few months ago that the same forecasting crowd confidently proclaimed that rates were only going higher. (Refer – The forecasting crowd creates great opportunities for others)
What’s far more relevant in our view is the implication of extremely low rates and flattening yield curves for portfolio construction today.
With the absolute levels of bond yields so low and compensation for taking duration risk very poor, using duration via conventional govt. bond investments for defensive risk diversification or downside portfolio protection is like buying a very expensive insurance policy. (Refer – Duration is now an expensive insurance policy)
The drivers of yield curve shapes
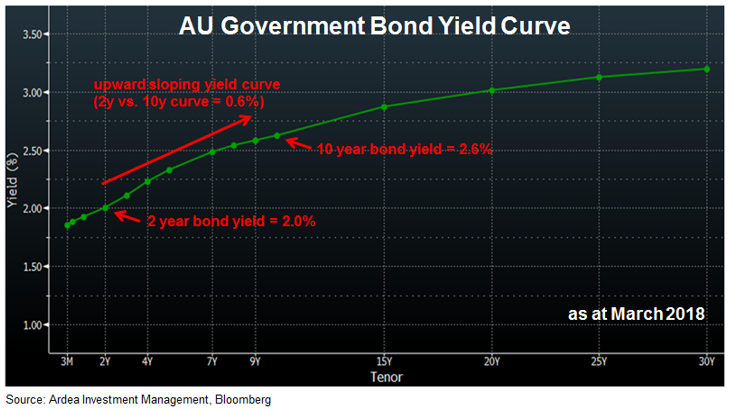
A yield curve refers to the graphical depiction of the yield that can be earned from investing in bonds of varying maturities. Typically yield curves are upward sloping, meaning that a long dated bond will offer investors a higher return (i.e. higher yield) than a shorter dated bond.
Generally, an upward sloping yield curve makes intuitive sense because investors in longer dated bonds are bearing more interest rate risk (measured by ‘duration’) and will therefore demand a higher yield to compensate for the additional risk.
The chart below shows the Australian government bond yield curve from a year ago. A 10 year bond offered a yield that was 0.6% higher than a 2 year bond.
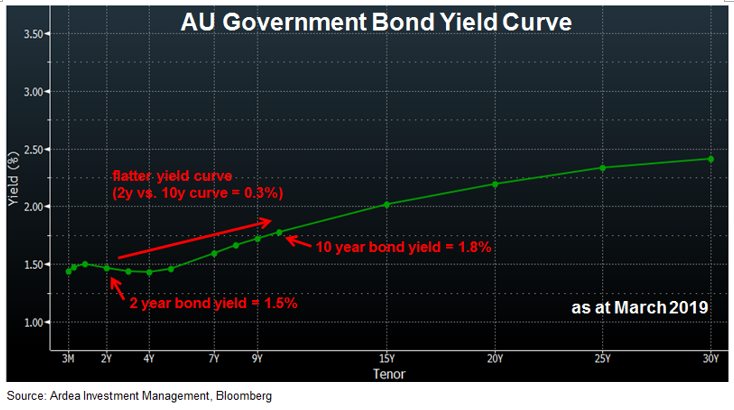
Since then, two things have happened simultaneously. The entire yield curve has shifted lower and the yield curve has flattened.
The chart below shows the same yield curve today. The yield curve has flattened, causing the difference in yield between 2 and 10 year bonds to halve from 0.6% a year ago to 0.3% today.
This dynamic has been even more pronounced in the US, where the 2 year vs. 10 year curve has flattened to just 0.1%, and the yield curve is actually inverted for short dated yields, as shown below.
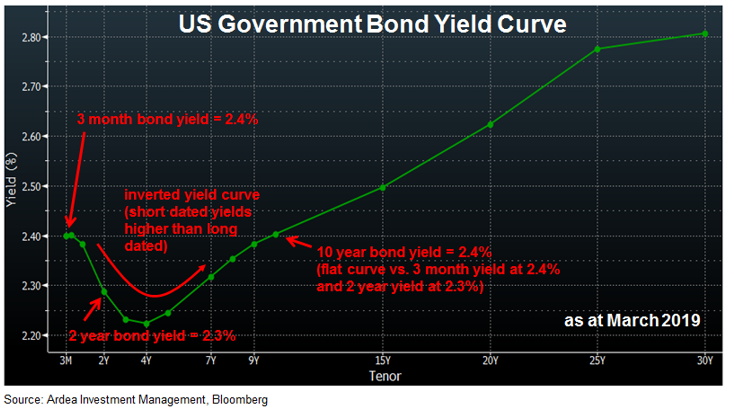
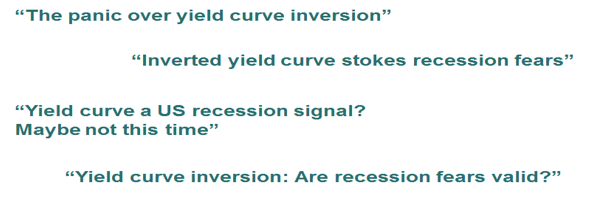
This inversion of the US yield curve is what’s been getting so much attention lately, prompting headlines likes the ones below;
From an academic perspective, the shape of the yield curve has two main drivers;
1. The yield for a particular maturity bond – say 10 years – reflects the expected path of future (short term) interest rates over the next 10 years, which is driven by expectations for the economy and monetary policy.
For instance, if a recession is expected, it would be reasonable to assume that interest rates will decline and therefore the yield curve out to 10 years will flatten and possibly invert.
2. The yield for that 10 year bond also reflects a risk premium – known as the ‘term premium’. This can be thought of as the extra compensation bondholders demand for taking the interest rate risk (i.e. duration risk) inherent in bonds, compared to cash deposits.
Therefore, a declining term premium will also have a flattening effect on yield curves.
(Note that an inverted yield curve doesn’t necessarily imply a negative term premium, because changing interest rate expectations also matter.)
The catch is that the term premium can’t be directly observed. It is calculated as a ‘residual’ … basically the left over bit that explains the difference between the actual observed yield and that predicted from the expected path of future rates.
The most widely cited measure of the US term premium was developed by economists at the New York Federal Reserve and is shown in the chart below, together with a similar measure for the AU yield curve produced by the Australian Office of Financial Management (AOFM).
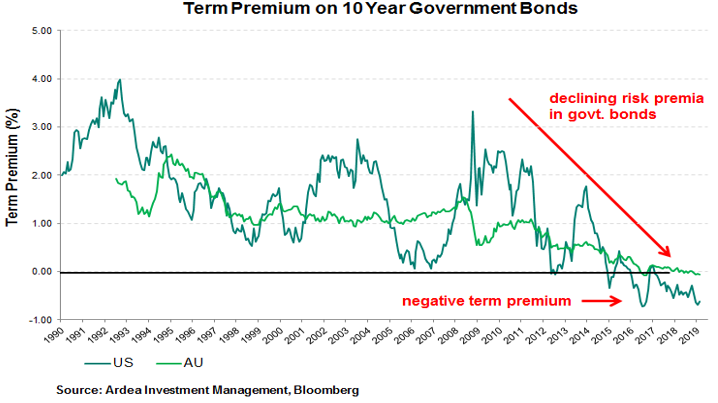
The chart shows that term premia in US and AU govt. bond markets is currently negative, which exerts a strong flattening pressure on yield curves, independent of the economic outlook.
All else equal, very low term premia make yield curve inversions more likely, even when the economic outlook is benign.
From a practical perspective, the shape of the yield curve is determined by the interaction between buyers and sellers of govt. bonds … basic demand and supply.
Therefore, an inverted yield curve could simply be a side effect of market participants being willing (or forced) to buy long dated bonds at yields that are lower than short term rates.
Some may be expressing a view that rates are headed lower due to recession risk but many others are buying for entirely different reasons (e.g. insurance companies matching liabilities, central banks pursuing policy objectives, banks holding bonds for regulatory reasons).
The idea that bond markets somehow ‘know’ something about economic conditions that others don’t is fanciful. There are simply lots of market participants willing to keep buying long dated bonds at ultra-low yields for many different reasons.
Hopefully, what is becoming apparent from this discussion is that yield curve shapes are driven by many variables interacting with each other and can therefore be subject to a lot of noise, which reduces their signalling value as economic indicators.