
Early Warning Indicators
Continuing the theme of tightening liquidity (refer QE winners become QT losers), Italian govt. bond markets are noteworthy as an early warning indicator.
As political turmoil in Italy raised the risk of populist (and anti-Euro) parties becoming a dominant force, Italian government bond markets sold off heavily in May and this spilled over into broader contagion of global bond and equity markets.
How bad was the sell-off in Italian bonds? We’re going to need a bigger chart …
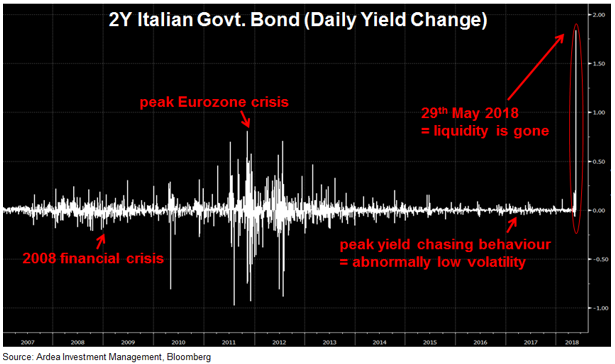
The one day move in the 2 year Italian govt. bond yield far exceeded the worst points of the 2011 Eurozone crisis and was an incongruous overreaction to the political noise that caused it. By comparison, the Italian equity market was down only 2.7% that day.
So, what caused this overreaction? Lack of liquidity.
“Both yesterday and today’s move appear amplified by incredibly light levels of liquidity”
– 29th May, Italian govt. bond market maker (i.e. a provider of liquidity)
As the chart shows, this is somewhat of an understatement.
For context, Italy’s govt. bond market is the 4th largest in the world and used to be very liquid. That is clearly not the case anymore and this outsized move is an early warning signal of just how bad liquidity has become outside a few core govt. bond markets.
Liquidity risk is severely underappreciated and under-priced across credit sensitive segments of fixed income markets such as corporate bonds, emerging market debt, periphery EU governments etc. and this is a structural problem (caused by bank regulation) that will get worse as rates rise, the US Federal Reserve keeps withdrawing liquidity and the ‘reach for yield’ unwinds.
Looking more broadly at some key market turning points so far this year – Italian govt. bonds, emerging markets selling off, widening money market funding spreads, weakness in short dated US investment grade corporate bonds – the proximate causes identified in each case seem unrelated but in our view there is actually a common theme linking the behaviour of all these seemingly disparate markets … the tightening noose of liquidity withdrawal.
This refers to the structural decline in trading liquidity but also more broadly to the withdrawal of USD funding liquidity as the FED raises rates and transitions from quantitative easing (QE) to quantitative tightening (QT), at the same time that rising US govt. debt issuance is sucking up dollars and draining excess cash holdings.
India’s central bank governor summed it up this way in a Financial Times opinion piece;
“ This unintended coincidence has proved to be a “double whammy” for global markets. Dollar funding has evaporated, notably from sovereign debt markets. Emerging markets have witnessed a sharp reversal of foreign capital flows over the past six weeks, often exceeding $5bn a week. As a result, emerging market bonds and currencies have fallen in value. ”
Another manifestation of tightening liquidity can be seen in financial conditions indicators such as the one shown below, which measure a broad range of financial variables including liquidity sensitive indicators.
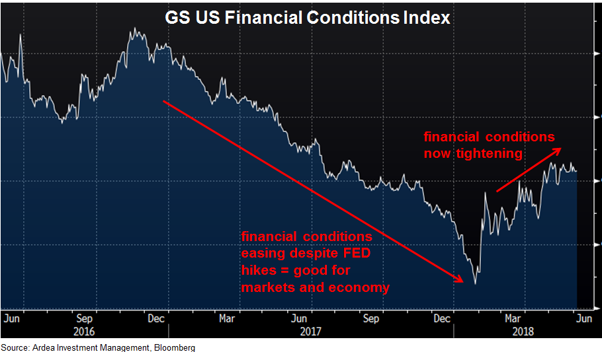
For the past 10 years all asset prices have benefited enormously from abundant liquidity provided by central bank stimulus, but this era is now coming to an end.
For now, markets are taking comfort from the FED’s insistence that monetary policy tightening and the resultant withdrawal of liquidity will be gradual.
But beneath the surface there are more and more early warning indicators flashing that liquidity is declining faster than most realise.