
Positive asset correlations and inflation assumptions
Conventional thinking about bond-equity relationships currently poses a paradox.
On one hand, this year’s sharp decline in global govt. bond yields, together with short dated interest rate markets in countries like the US and AU pricing in rate cuts, is interpreted by many as indicating a growing probability of recession.
On the other hand, equities globally are having one of the best Q1 rallies on record.
The resolution to this seeming paradox is the changing bond-equity correlation.
The majority of balanced portfolio construction frameworks rely on a single assumption – a negative correlation between equity and bond prices, meaning they should generally move in opposite directions. This has been the main diversification play over the entire career span of most portfolio managers who are active today.
However, as a result of central bank actions and shifting economic growth / inflation paradigms, we are now seeing this correlation becoming more frequently positive.
We’re now back to a market environment that’s entirely supported by central banks. That’s why bond and equities have rallied together in the first quarter of this year.
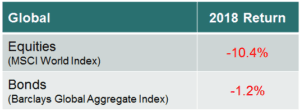
In fact, as Deutsche Bank points out in the chart below, pretty much everything rallied in the first quarter of 2019. A positive correlation across asset classes is widely evident and entirely underpinned by central banks.
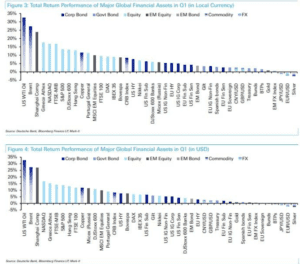
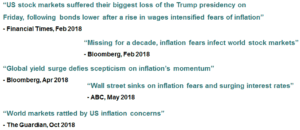
2018 was also highly correlated, but in the opposite direction.
This resulted in the worst year on record for the number of asset classes that posted negative returns globally.
Last year it was the fear of central banks tightening policy too aggressively that caused bond markets to become the catalyst for the largest US equity market drawdown since the 2008 financial crisis and a global sell-off across most asset classes. (Refer – The central bank bar tab)
What turned things around was the abrupt late December change in the US Federal Reserve’s (FED) rhetoric.
In the face of growing downside risks to the economic outlook, and perhaps also as a concession to financial market volatility, they switched to a more soothing tone, emphasising their willingness to be patient about any further tightening of monetary policy.
We went from headlines like this in 2018;

To headlines like this in 2019;

And this month stocks continued to rally, while bond markets really got fired up as the dovish turn by central banks continued and the slower economic growth / lower interest rates scenario has become the overwhelming consensus view.


Last year stocks sold off and bonds struggled because central banks became the market’s bogeyman.
So far this year both bond and equities are strongly rallying as central banks are now perceived to be the market’s saviour. So, what could trigger a reversal back to the 2018 dynamic of bonds and equities selling off together?
In a word: inflation.
Which is why headlines like this are more meaningful than a quick glance might suggest;

Equities and bonds have both been rallying in the confident belief that central banks won’t be hiking rates any time soon, and in fact may end up cutting rates to stimulate growth.

But if inflation comes back, that confidence will crumble and central banks will once again become the markets bogeyman, as the fear of inflationary pressures forcing them (the FED in particular) to raise rates will dominate.
Recall, it was only last year when this is exactly what happened.
Since then, even though some indicators of inflation have moderated, others have continued to rise.
For example, the chart below shows US core personal consumption expenditures (PCE), which is the FED’s preferred inflation measure, together with US avg. hourly earnings (AHE), which is a measure of wage inflation.
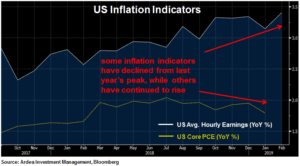
While core PCE has declined a bit from last year’s peaks, AHE has continued to rise and is now above the level that caused the mini inflation scare in Feb last year. This is hardly a conclusive picture of collapsing inflation. (We’ve covered US wage inflation before – Ghosting in the US job market)
Yet, market pricing of inflation expectations has in fact collapsed below last year’s levels.
The chart below shows prices of US and AU 10 year inflation swaps, which reflect market expectations for inflation over the next 10 years (there are also implicit liquidity and inflation risk premia reflected).
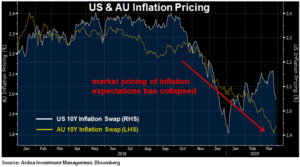
In both countries, markets have quickly moved to price lower future inflation outcomes. The move has been particularly pronounced in AU, because wage growth hasn’t been rising as it has in the US, house prices are more of a concern and economic momentum is generally weaker.
While it’s impossible to reliably predict whether inflation will in fact fall or not in future, what we can see is that markets are now back to betting heavily in one direction … lower inflation for a long time.
This is part of a broader theme of market consensus becoming heavily skewed to a lower growth / lower rates scenario, which we also see reflected in the sharp decline of bond yields this year, together with the flattening of yield curves.
Notably, this scenario is now finely balanced as a positive for equities, because it also implies that central banks won’t raise rates any time soon, which was the big fear last year.
Tying this all together, any upside surprise to inflation would be most unwelcome because it puts rate hikes back in play, quickly returning us to the early 2018 paradigm of bonds and equities selling of together.
For most of the post financial crisis period we were in a paradigm of ‘good inflation’ i.e. inflation was viewed as a positive sign of stronger economic growth, which was good for asset prices.
Given the sensitivity around central bank policy tightening, particularly in the US, we can quickly flip to a ‘bad inflation’ paradigm i.e. fear of an inflation overshoot forcing aggressive rate hikes … a small taste of which we got in early 2018.
Aside from the negative impact on asset prices, this shift would also have major consequences for portfolio construction, given the implicit assumption of a negative bond-equity correlation in most portfolios.
Inflation is a risk to this assumption because the negative correlation is heavily dependent on the ability of central banks to anchor inflation expectations within their target range. If they fail to keep doing this, the bond-equity relationship breaks down.
Remember, prior to the late 1990’s bonds and equities went through long periods of positive correlation because inflation expectations and interest rates were more volatile.
We got just a small taste of this in October last year, when the classic 60/40 equity vs. bond portfolio experienced its largest drawdown since the 2008 financial crisis. (Refer – Conventional fixed income is not doing its job)
Because human nature is vulnerable to recency bias, it’s easy to forget how quickly things can change.
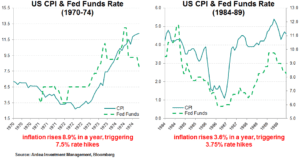
The charts below show periods in history when rapidly rising inflation forced aggressive rate hikes causing both bonds and equities to sell off.
As memories are short, this scenario has now disappeared from most portfolio construction playbooks.
While we can’t predict whether the consensus low growth / low rates / low inflation scenario will play out or not, we can observe that markets are already heavily pricing it in.
This means that trades positioning for the opposite outcome are now offering more positive asymmetry (i.e. limited downside vs. disproportionately large upside) … if you can’t predict the future, having asymmetry on your side is the next best thing.
Volatility strategies are our preferred way to play this (higher inflation = higher rate volatility), as they have maximum asymmetry and positive convexity (Refer – How to profit from interest rate volatility)
But for those who can’t use options, there are alternatives such as positions which exploit the strong inversion of short dated US interest rate curves or those that take advantage of the blunt extrapolation of current low inflation conditions far into the future (Refer – Better ways to position for future inflation surprise)
These types of relative value positions offer favourable asymmetry and better risk vs. return characteristics than blunt directional approaches such as varying duration exposure to pick market direction.