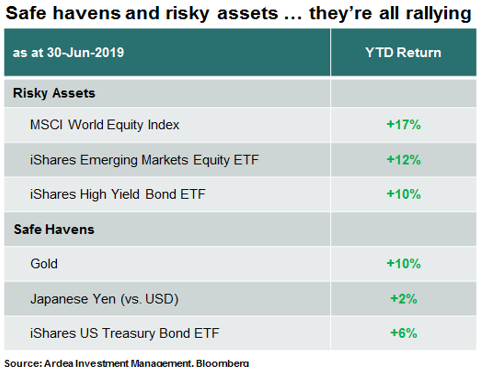
Safe havens and risky assets rallying at the same time
Gold bugs were celebrating in June as the price of gold finally broke above the $1400 price ceiling that has held since 2013. Headlines like this one from Bloomberg referenced the gold rally in the context of its traditional ‘safe haven’ role;
“Gold rebounded from its biggest decline in more than two years on signs of fresh strains on the global economy”
Wouldn’t this suggest traditional ‘risky assets’ such as equities should be falling? Wrong … equities globally have just posted one of the best six month periods on record.
How is it that traditional safe haven assets like gold, government bonds and the Japanese yen are all performing strongly this year, just as risky assets like equities, credit and emerging markets are also doing very well?
One answer is that central banks have decided to keep the bar tab open, the asset price party is back in full swing and everyone is welcome. We covered this ‘lower for longer’ interest rates theme here.
Historically, the potential for central bank rate cuts to stimulate economic growth was viewed as a safety net (the so called ‘central bank put’) but now the central bank put has actually become the main driver of asset prices … risky assets and safe havens alike.
Which begs the question, when traditional safe haven assets are rallying strongly with equities, can they still provide downside protection if equities turn?
On this point, strategists from BofA Merrill Lynch noted the following;
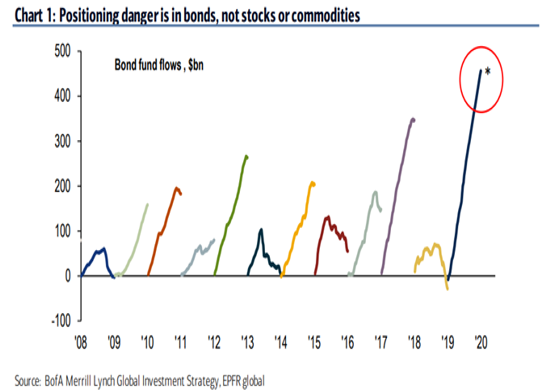
“The most important flow to know: annualized inflows to bond funds = staggering record $455bn in 2019; compares with $1.7tn inflows past 10-years; positioning danger is in bonds, not stocks or commodities”
– BofA Merrill Lynch, The Flow Show, Jul 2019
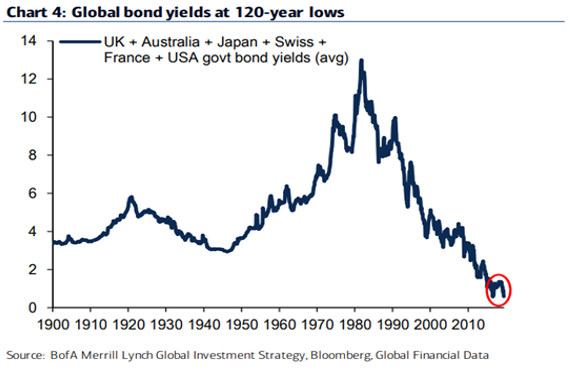
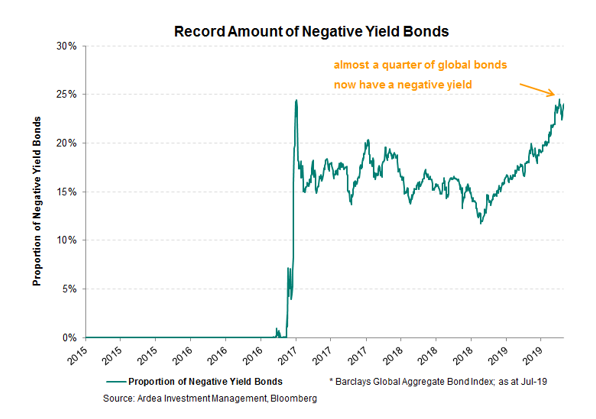
The charts below show record inflows to bonds, at a time when yields are already at record low levels and a record 24% of global bonds have a negative yield. A combination that puts bond markets in a precarious position.
Bonds are supposed to be the safe haven that protect portfolios when equities fall but may actually end up being the catalyst for the next equity drawdown, if extreme investor expectations and positioning around the ‘lower for longer’ interest rates theme is disappointed.
(Note re chart 1, the previous peak in bond inflows was late 2017 / early 2018 … just before the bond market sell-off that triggered 2018’s global equity drawdown.)