
Long term bonds – relative value and risk in a low yield world
- Strong demand for a new 30 year bond in Australia highlights the importance of yield curve shape and global relative value dynamics for investors.
- Globally, longer curves are boosting yield pickup, but also duration risk and the balance for passive investors is unfavourably asymmetric.
- Relative value strategies can capture the yield pickup in longer term bonds, while limiting downside risk.
In July, the Australian government extended its yield curve with a new 30 year bond. The issue received record interest from global investors against a backdrop of massive central bank intervention and rising issuance volumes everywhere. The relative shape of the yield curve in a local and global context explains the strength of demand for this new long-term bond. Long maturity bonds still provide significant yield enhancement relative to short maturity bonds, but the inherent rise in duration risk is a double-edged sword that is becoming increasingly asymmetric for investors. Relative value strategies can offset this risk, while still taking advantage of higher yield premiums.
Australia extends its yield curve to 2051
In July, the Australian government priced their longest ever bond, maturing in June 2051, at a yield of just under 2.0%. The deal marks the second ever 30 year nominal bond line after the March 2047 bond was issued in 2016. The initial issuance size of the June 2051 bond, at $15bn, is the largest ever for an Australian long-term bond issue (beyond 10yrs). The government received just under $37bn of bids from investors for the issue, implying very strong demand. $15bn in one transaction is a helpful step towards funding a budget deficit in excess of $180bn in 2020-21 (the budget could end up in much worse shape given the uncertainty around virus containment and the economy). The market is braced for a large increase in bond supply in Australia and across the world.
Yield curve shape is a critical driver of bond demand
Why was there strong demand for this latest 30 year bond? The answer is in the shape of the yield curve and depends, in part, on where in the world an investor is based.
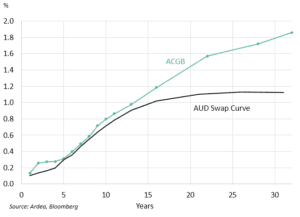
First, consider the case for buying a 30 year bond from a domestic investor’s perspective. Figure 1 shows the 30 year yield is just under 2.0% – a high level compared to a cash rate of near zero and a 3 year yield of 0.25% – both of which are effectively locked down for the foreseeable future by RBA policy. A 30 year yield currently offers twice the pickup of a 10 year bond yield. Figure 1 also shows bond yields trade at a wider margin above the swap curve at longer maturities, than at shorter maturities. This is significant for two reasons: 1) investors can also use the swap market instead of bonds to gain exposure to movements in long term rates; 2) swap versus bond curve comparisons can provide an indication of the supply/demand risk premiums embedded within bonds.
Figure 1: Australian Government bond and swap curves
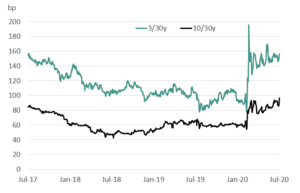
This steepness of the bond curve beyond 10 years is historically significant. Australia has had a near-30 year bond maturity since 2016 (when a 2047 maturity was first issued). Figure 2 shows the yield pickup for extending from 3 year or 10 year bonds into a 30 year bond is currently near the highest level since 2017 at around 150bp at the time of writing. The basic reason is that longer term Australian yields have not been as suppressed by RBA policy and other global economic forces to the same extent as shorter term yields. Of course, this yield curve shape could change over time – either long term yields end up falling closer to where short term yields are currently trading or they could go even higher. There is greater uncertainty over the path for interest rates at longer horizons and this increased risk is a key reason 30y bonds offer a relatively higher yield.
Figure 2: Australian Government 30Y yield pickup relative to 3y and 10y bonds
Beyond the yield pickup over cash, shorter maturities and the swap curve, a 30 year bond also offers investors a greater convexity benefit than shorter maturity bonds. This concept of convexity essentially means that the price of the bond will rise more sharply for a given fall in yields than fall for a given rise in yields (although the overall interest rate risk involved in long term bonds is significantly higher, as shown below).
Global supply and demand dynamics are driving yield curve extensions and cross market allocations
There is a global trend towards longer tenor bond issuance as government funding tasks rise rapidly. Most major sovereign bond markets have at least a 30 year maturity and some European curves extend all the way to 100 years, leaving global investors with a large, liquid universe to invest in. Yet the latest Australian 30 year bond featured the highest ever offshore participation for a new issue (non-resident investors accounted for 67% of the initial issue volume, compared with an average of 38%). This increased global demand reflects the relative value appeal of this bond and the shape of the Australian yield curve compared with other major markets.
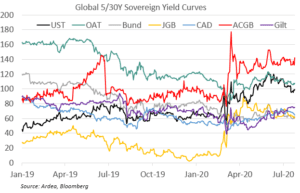
Figure 3 shows that most developed markets have a similarly low and flat yield curve shape between 1 year and 5 year maturities. The differences in yield levels at these shorter maturities generally reflects the starting point for the respective cash rates (negative or slightly positive). Further out the maturity spectrum, yield curve shapes vary considerably. The ACGB curve is currently steeper than peer markets and the extent of this gap has widened since the start of the COVID-19 crisis (Figure 4).
Figure 3: Major sovereign yield curves
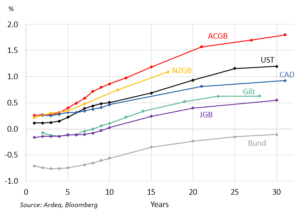
Figure 4: 5y vs 30y yield curve spreads
Why does this divergence in global yield curve shapes exist and what explains the recent Australian steepness? There are a vast number of factors that explain the different yield curve dynamics across markets. We note five of the major drivers.
- Unconventional monetary policies. There is wide spectrum of central bank asset purchase programmes, which vary in terms of the bonds targeted (government and/or credit), duration, quantity and the nature of the commitment to market intervention. The RBA targets only the 3 year part of the curve with purchases conditional on the yield rising noticeably above a 0.25% target. Other central banks, such as the Fed and ECB are active across the whole yield curve without specific yield targets. Meanwhile, negative rates are favoured by some central banks such as the ECB and BOJ, but not others like the Fed and RBA.
- Fiscal policy and bond supply. The magnitude of global fiscal easing is unprecedented and adding to supply discounts across all bond markets. Since the COVID-19 outbreak, the IMF estimates global direct spending and revenue measures total US$3.3tn, while loans, equity injections and guarantees total US$4.5tn (see here for more detail). All countries are spending a lot of money right now, which is driving an explosion in bond issuance, yet the impact on yield curves is not distributed evenly. Countries like Australia started the crisis with more capacity to target direct spending measures rather than only focus on contingent forms of spending like guarantees (RBA Governor Lowe noted Australia’s relatively low starting point for sovereign debt in a recent speech). But after adjusting for a relatively smaller volume of central bank purchases, the step change in the outlook for Australian bond supply for private investors to absorb is large relative to pre-COVID assumptions.
- Bond market liquidity. There are major differences in investor duration preferences, bank trading capacity and issuance behaviour across markets. These factors, among other drivers of liquidity, lead to significant differences in risk premiums between markets. For example, the UK and many European sovereign issuers have sold large volumes of bonds at longer tenors with greater participation from large pension and insurance funds. In contrast, smaller markets like Australia have historically had lower fixed income allocations from fewer long duration focused investment funds.
- The economic outlook. The massive synchronised short-term growth and inflation shock delivered by COVID-19 is reflected in all yield curves, but over the longer term there are greater differences between investor assumptions on growth and inflation prospects.
- FX implications. Investors seeking global fixed income returns need to manage currency risk. The level of spot and forward FX hedging costs can make or break fixed income allocation decisions for large global bond investors, thereby impacting relative global yield curve spreads. For example, Australian bonds are currently cheap compared to some other markets even after accounting for the cost of a short term currency hedge (such as a 3 month or 6 month FX forward position).
Longer yield curves are a double-edged sword: expected returns are higher, but so is duration risk
Longer maturity issuance in all markets is providing investors with opportunities for greater yield pickup relative to low short-term yields. This return potential, however, carries increased risk. The longer tenor of issuance is increasing the duration of the global bond market at a time when the average level of yields is at a record low. Figure 5 shows a global sovereign bond index duration at a record long 8.7 years, while the average yield is at a record low 0.43% (the equivalent Australian government bond index figures are 6.6 years and 0.69% yield, respectively). Targeting only long term bonds for the yield pickup would lead an investor to take on even greater duration risk than the index.
Figure 5: Bloomberg Barclays Global Aggregate Government Bond Index duration, average maturity and yield
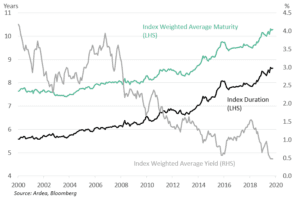
We have written previously about the asymmetric risks that come with longer duration and lower yields (see here for more detail). The basic conclusion is that the global bond market is now more sensitive than ever to the risk of rising yields and the potential for further capital gains from falling yields is constrained. The increased prevalence of ultra-long maturity bonds, while return-enhancing at the margin for investors, will ultimately only further tilt the broader market risk/reward balance in an unfavourable direction. This environment makes passive index following fixed income strategies increasingly vulnerable to any correction in yields.
Relative value strategies can take advantage of the yield pickup in longer term bonds, while limiting duration risk
An active, relative value focused investment strategy can take advantage of the higher returns offered by long term bonds, while eliminating the risks associated with increased duration exposure.
RV strategies can profit whether yields rise or fall but are still able to capture the risk premiums offered by larger supply at longer tenors. This is achieved by targeting specific cheap bonds and implementing offsetting trades to manage duration risk.
The specific trading strategy around long term bonds depends largely on the particular shape of the sovereign yield curve and many other factors. A few examples of strategies to capture longer term yield premium while managing portfolio duration exposure are:
- offsetting long duration bond positions with short positions in swaps or futures;
- holding long positions in bond options and swaptions across a portfolio to benefit from unexpected changes in yields and volatility (see here for more detail);
- establish protection against inflation risk (see here for more detail);
- balancing the risk of a portfolio with positions across fixed income markets in multiple currencies.
This material has been prepared by Ardea Investment Management Pty Limited (Ardea IM) (ABN 50 132 902 722, AFSL 329 828). It is general information only and is not intended to provide you with financial advice or take into account your objectives, financial situation or needs. To the extent permitted by law, no liability is accepted for any loss or damage as a result of any reliance on this information. Any projections are based on assumptions which we believe are reasonable, but are subject to change and should not be relied upon. Past performance is not a reliable indicator of future performance. Neither any particular rate of return nor capital invested are guaranteed.