
Bonds don’t always diversify equity risk
Key Points
- The interest rate duration inherent in conventional bond investments is the central diversification play used by most balanced portfolio construction frameworks.
- This is entirely reliant on a single assumption, which is that a negative correlation between equity and bond prices will ensure that bonds provide downside protection when equities incur losses.
- The experience of 2018, together with a long history prior to the 2008 financial crisis, shows that bond-equity relationships are actually not stable and bonds don’t always diversify equity risk.
- The negative correlation assumption holds when the catalysts for the equity sell-off are consistent with conditions that lead to lower interest rates / bond yields.
- The assumption can fail when the speed of, and/or catalysts for, rising bond yields hurt equity markets, causing bonds and equities to incur losses at the same time.
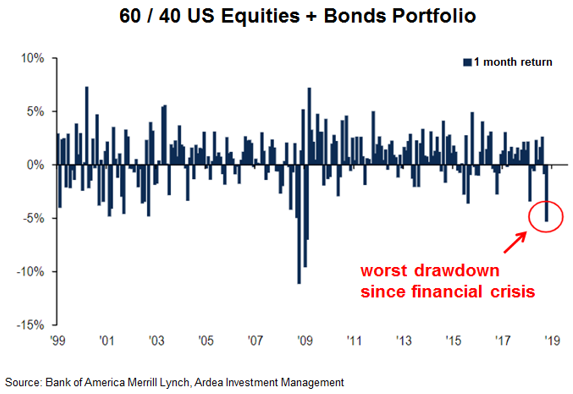
- The implications for portfolio construction were clear in October 2018, when a classic 60/40 US equity+ bond portfolio experienced its largest monthly drawdown since the 2008 financial crisis.
- Even if the assumed negative correlation does hold, when the starting point of bond yields is already very low, duration becomes far less effective as a diversifier for equity risk.
While duration does work in many scenarios, with bond yields already so low and bond-equity relationships becoming unstable again, it’s important to not rely on just one diversification lever.
As such, we see a growing number of investors seeking to upgrade the risk diversification in their portfolios by adding other alternatives that can fill the gap when their conventional duration based investments don’t work as expected.
They also recognise the danger in pinning their entire risk diversification strategy on a single assumption and are therefore seeking to mitigate ‘decision risk’ in the portfolio construction choices they make.
In our view, more reliable risk diversification for equity skewed portfolios can be achieved by adding investment strategies that have no structural link to economic cycles or have return profiles that offer additional upside when equities incur losses.
Introduction
With global bond yields back at the low end of recent ranges and at record low levels in Australia, it’s time to revisit a theme that’s at the heart of portfolio construction – the bond vs. equity correlation.
The majority of balanced portfolio construction frameworks rely on a single assumption – a negative correlation between equity and bond prices.
The expectation is that when equity prices fall, bond yields also fall and therefore the interest rate duration exposure inherent in bonds delivers capital gains to offset equity losses.
Following from this, interest rate duration has been the main diversification play relied upon over the entire career span of most portfolio construction professionals active today.
However, the experience of 2018, together with a longer history prior to the 2008 financial crisis, shows that bond-equity correlations are actually not stable, and the negative correlation assumption doesn’t always hold.
The question of whether duration works as a risk diversifier is not a binary one. Rather, it requires a more nuanced analysis that looks beyond correlation statistics to understand the causal links that drive real world examples.
The more relevant questions to ask are – Under what conditions will the negative correlation hold? When will it break down? Can duration continue to provide the same downside protection against equity risk that it has in the past? Is it still an effective portfolio insurance policy?
These questions become most relevant when the starting point for interest rates / bond yields is already very low and there is higher uncertainty around central bank actions … the exact conditions we face today.
In our view, there’s too much risk in pinning an entire portfolio diversification strategy on the single assumption that conventional duration based bond investments always diversify equity risk.
The conventional correlation assumption
Focusing on labels would suggest defensive fixed income (FI) investments begin and end with duration based government bond investments.
Those with looser risk constraints may also include diversified fixed income (DFI) investments under the ‘defensive’ label. Such investments have more tolerance for credit risk and therefore include investment grade, and even high yield or emerging market corporate bonds in their portfolios.
In both cases, the common underlying assumption is that when equities fall, bond yields decline, resulting in capital gains on bonds to help offset equity losses. The more duration you have, the stronger this effect.
Therefore, the conventional portfolio construction assumption is that adding the duration exposure inherent in bonds to a broader investment portfolio improves risk diversity and provides downside protection against equity risk … like an insurance policy.
As Goldman Sachs notes;
“The shift to negative equity/bond return correlations in the late 1990s was one of the most important developments in asset allocation as it has improved diversification of multi-asset funds (both traditional balanced and those focused on absolute returns) …”
– Goldman Sachs, GOAL report 14-Nov-2016
A side note on correlation
Correlation is just one of many statistical measures used to describe relationships between variables.
The most widely used correlation measure is ‘Pearson’s correlation co-efficient’, which is a scaled measure ranging between -1 and +1. A strong negative correlation would tend towards -1 and a strong positive correlation toward +1.
In a financial context, the common interpretation of positive correlation is that two variables generally move in the same direction.
For example, if stock A and stock B are positively correlated, it’s expected that they rise and fall together. If they are negatively correlated, they’re expected to move in opposite directions.
This is how correlation statistics are commonly interpreted in general use and (most of the time) this is good enough to get a sense of the relationships you’re trying to understand.
However, digging into the details, there are times when correlation can be misleading because it assumes a linear relationship between the variables and what it actually measures is how the deviation of one variable from its average value relates to the deviation of the other variable from its own average value.
So, if over the period being assessed, stock A was trending up, while stock B was generally heading down, they can both be positively correlated even though stock A’s average return over the period was positive, while stock B’s was negative.
The positive correlation simply tells you that both stock A and B were generally above or below their own respective trends at the same time. It ignores the fact that those trends were in opposite directions.
This is why it’s important to understand the underlying drivers of the variables being studied and to remember that correlation tells you nothing about the causal relationship between them.
It could just be pure coincidence that they are positively or negatively correlated and actually have no fundamental relationship with each other. (Refer – lies, damned lies and correlations)
In the context of bond-equity relationships, you need to look beyond the correlation statistics to understand how the causal links between them change through economic cycles.
When does the correlation assumption hold?
There are certainly scenarios in which this assumption holds.
For example, in a recession or 2008 financial crisis type scenario, it’s likely that bond yields will drop and therefore duration exposure will provide gains to offset equity losses.
The causal link here is that the catalysts for the equity sell-off need to be consistent with conditions that lead to lower interest rates / bond yields.
For example, central banks may cut interest rates in response to recession risk or in a financial crisis there may a be a ‘flight to safety’ dynamic, resulting in higher capital flows to bonds causing bond prices to rise / yields to fall.
In these cases duration does work to protect downside equity risk because the causal link ensures the negative correlation between bonds and equities holds.
This is generally what we’ve seen over the past 20 years because central banks have been willing to respond to economic growth shocks by cutting interest rates aggressively, and they have been able to do this because inflation expectations have been anchored.
More specifically, this dynamic works best when the starting point of interest rates and bond yields (i.e. the ‘yield cushion’) is relatively high heading into the equity sell-off.
When the yield cushion is already very low, as it is in the current environment, there is simply less room for yields to fall further and therefore bonds don’t provide as much downside protection.
So, even if the negative correlation holds, duration is now an expensive insurance policy, which no longer pays out as much even if it does work. (Refer – duration is now an expensive insurance policy)
When does the correlation assumption fail?
For bonds to work as downside protection against equity risk, a negative correlation between bond and equity prices is generally needed i.e. when equity prices drop, bond prices need to go up.
(This is a generalisation, as explained in the side not on correlation.)
While this assumption has generally held since the early 2000’s, a longer history, as shown in the chart below, makes it clear that bond-equity correlations are not stable.
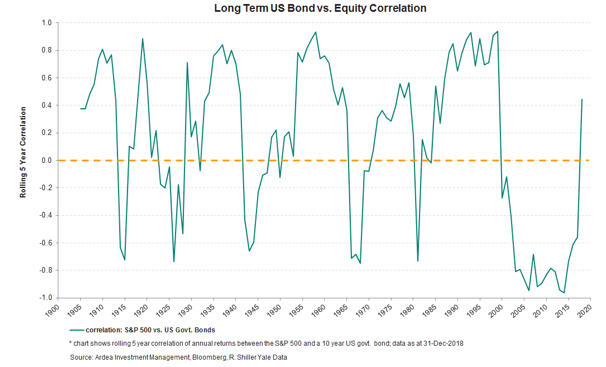
Since the early 2000’s central banks have generally exerted downward pressure on interest rates, while inflation expectations remained anchored at very low levels. This combination was perfect for keeping the correlation mostly negative.
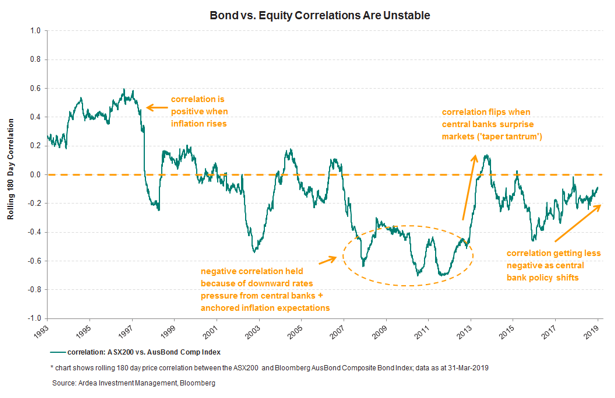
Prior to this period, shifting central bank policy and inflation paradigms caused bond-equity correlations to swing around significantly. More specifically, it’s the speed and catalysts of the increase in rates / bond yields that are the causal links. When bond yields rise quickly, correlations shift to positive as the rate shock hurts equities.
This can happen when central banks surprise markets, as the US Federal Reserve (FED) did during the ‘taper tantrum’ of 2013. Back then FED Governor Ben Bernanke unexpectedly announced the possibility of reducing the FED’s bond buying program, causing bond yields to rise sharply, triggering a sell-off in equities.
These shifting paradigms are shown in the chart below for shorter horizon Australian bond-equity correlations.
The perception is that bonds are an insurance policy that protects against downside equity risk, but the reality is that unstable bond-equity correlations may result in the policy not actually paying out when it’s needed.
The current situation
One scenario in which a causal link results in bond-equity correlations becoming positive is when strong economic growth and rising inflation expectations trigger fears of an aggressive central bank response (i.e. rapid rate hikes), leading to an equity sell-off.
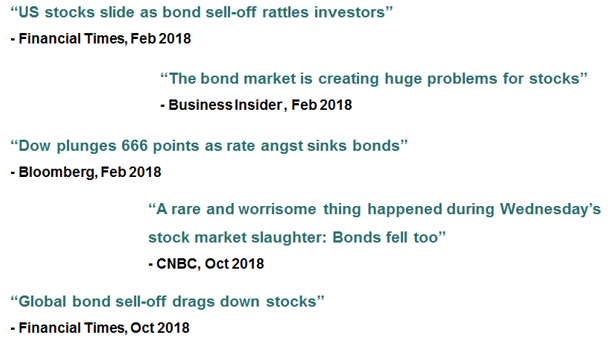
This is exactly what we got a taste of in early 2018, when the fear of the FED tightening policy too aggressively that caused bond markets to become the catalyst for the largest US equity market drawdown since the 2008 financial crisis and a global sell-off across most asset classes. (Refer – The central bank bar tab)
Headlines like these captured the zeitgeist;
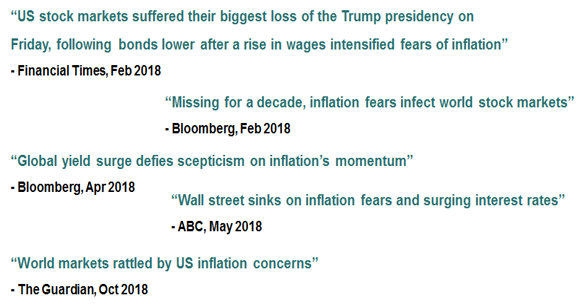
Prior to 2018 we had been in a ‘good inflation’ paradigm. This is when inflation rising from very low levels is positive for equities, as it’s viewed as a sign of stronger economic growth.
However, in 2018 we transitioned to a ‘bad inflation’ paradigm. This is when concern about inflation overshooting targets raises fears of aggressive rate hikes.
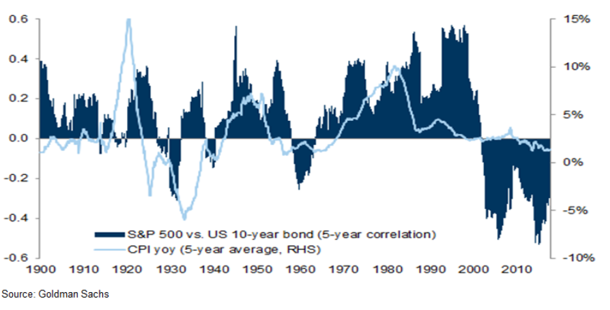
We see these paradigm shifts throughout history, where periods of high inflation are associated with positive bond-equity correlations, as shown in the chart below.
So why hasn’t the negative correlation assumption received more scrutiny?
Perhaps just because of short memories – since the mid 1990’s government bonds have benefitted from a secular bull market, driven by strong central bank support and anchored inflation expectations, both of which have underpinned the negative correlation thesis.
Prior to 2018, you need to go all the way back to the late 1980’s / early 1990’s for the last time rising inflation upset the negative correlation assumption … so it’s something that most investors are simply not used to. (Refer – positive asset correlations and inflation assumptions)
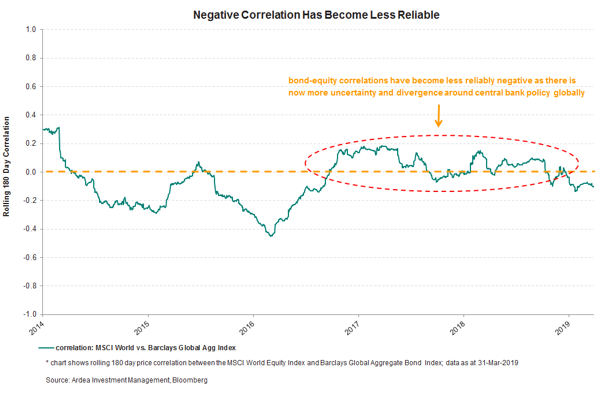
More generally, bond-equity correlations have become less reliably negative in recent years as there has been greater divergence and uncertainty around central bank actions globally.
The chart below compares the correlation of the MSCI World equity index to the Barclays Global Aggregate Index.
While this correlation has broadly followed the same directional pattern as the Australian government bond-equity correlation, it has been more positive in absolute terms because this index includes credit securities, which have a stronger positive correlation with equities. (Refer – low yields increase the equity beta of credit investments)
This is relevant because many DFI funds, which are increasingly prevalent in defensive FI allocations, track against this index and have been persistently overweight credit in their portfolios.
The implications for portfolio construction
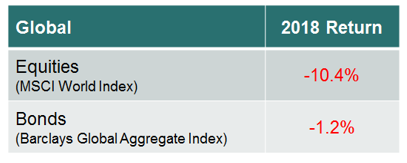
2018 gave us just a small taste of what happens when the assumption of a negative bond-equity correlation fails to hold as bonds, rather than diversifying equity risk, actually became the catalyst for the equity sell-off.
And the most commonly used benchmark index for global DFI funds ended the year negative. So, rather than diversifying equity risk, these bonds actually added to equity losses.
The direct implications for portfolio construction became particularly clear in October 2018, when a classic 60/40 US equity + bond portfolio experienced its largest monthly drawdown since the 2008 financial crisis.
Back in 2008 the drawdown was larger despite positive bond returns because equities fell a lot more. Last year equities didn’t fall nearly as much but bonds actually added to equity losses. (Refer – Conventional fixed income is not doing its job)
Looking forward, it’s impossible to predict whether last year’s catalysts for positive bond-equity correlations (i.e. sharply rising interest rates/bond yields, shifting central bank policies, rising inflation expectations etc.) will return or not.
Either way, last years’ experience and longer history shows that the assumed negative correlation between bonds and equities is not as reliable as hoped for.
While duration certainly works in many scenarios and therefore continues to play a role in portfolio diversification, with bond-equity relationships now becoming unstable again and the current level of bond yields already very low, it’s more important than ever to not rely on just one diversification lever.
The nuanced consideration is around how the duration exposure inherent in conventional bond investments will behave in different scenarios, how those behaviours can change in varying market environments and whether they can provide reliable diversification benefits.
Looking beyond labels, investments that are commonly assumed to provide diversification benefits and downside protection against equity risk, may behave this way in some market environments but at other times can actually behave the opposite way and incur losses just as equities fall.
From our experience, there are two types fixed income investments that provide genuine risk diversification benefits for portfolios that already have equity and credit exposures;
- investments that maintain reliably low correlation to equity markets when they incur losses
- investments that have complementary risk and return profiles to equities
An example of the former would be non-conventional strategies, whose return sources have no underlying fundamental or structural links to economic cycles and equity markets.
An example of the latter would be interest rate volatility strategies, whose return profiles can be structured to provide additional upside when equity markets incur losses.
There’s a lot more to fixed income than just buying bonds. It‘s an asset class with a wide range of instruments, strategies and return sources that can be exploited to achieve genuine risk diversification.