
Low yields increase the equity beta of credit investments
(Note: Within the broad universe of credit investments, this discussion focuses specifically on corporate bonds because they are most prevalent in conventional credit and diversified fixed income portfolios.)
Key Points
- With yield chasing capital flooding back into credit markets and pushing up bond prices, the yields offered by many corporate bond portfolios are now barely higher than cash deposit rates.
- We have previously covered the obvious question of whether credit investors are getting adequately compensated for risk. (Refer – why are you accepting more risk for less return)
- The more subtle consideration for portfolio construction is how the behaviour of credit investments can change when yields are very low.
- A credit investment’s yield can be split into an interest rate component and a credit spread component, both of which exhibit different sensitivities to equity market fluctuations.
- While the interest rate component can be negatively correlated to equities, the credit component is positively correlated, which is what can drive losses on credit investments when equities fall.
- In the past, higher bond yields meant the interest rate component dominated corporate bond returns, which reduced their equity beta in adverse market environments.
- With bond yields now very low, the credit component becomes more dominant, which increases the equity beta of corporate bonds and therefore amplifies losses when equities fall.
- This is particularly relevant for diversified fixed income (DFI) portfolios, which have relied on credit investments to generate returns.
- While these credit exposures can drive higher returns in good times, they also introduce equity beta into portfolios, which compromises their defensiveness in adverse market environments.
- This hidden equity beta in DFI portfolios becomes more pronounced when bond yields are very low, as we saw in Q4 2018 when many DFI and similarly unconstrained fixed income portfolios incurred steep losses on their credit exposures as equities fell.
We find that investors are generally aware of the equity beta inherent in pure credit investments such as high yield bonds and loans, but are often surprised that it also exists in DFI portfolios, which are widely labelled as ‘defensive’ allocations within broader investment portfolios.
For portfolios that already have material equity holdings, adding the credit exposure inherent in DFI investments could actually result in doubling up rather than diversifying risk when equities fall, which is why it’s important to look beyond labels.
Credit investments generally and the allocation to corporate bonds in DFI funds specifically, is neither inherently good nor bad. What matters more for achieving risk diversification is considering how these exposures will behave in different scenarios, how those behaviours can change in varying market environments and how they will interact with other assets in the portfolio.
In our view, genuine risk diversification for equity skewed portfolios comes from adding strategies that have no underlying structural link to the performance of equity markets or have return profiles that provide potential for additional upside when equities incur losses.
The ‘yield pick-up’ in credit markets is vanishing
Following the 2008 financial crisis, a dominant theme across global financial markets has been the effect of ultra-low interest rates on investor behaviour.
In fixed income this manifested as a migration of capital into progressively riskier credit investments in search of anything that could provide higher returns … the so called ‘reach for yield’.
This yield chasing dynamic was briefly disrupted in Q4 last year, as the fear of higher interest rates caused steep losses for equity and credit markets, but with consensus expectations once again highly skewed to the prolonged low interest rates scenario, the reach for yield is now back in full force.
For example, early April saw the 2nd largest weekly inflow ever into USD investment grade bonds ($11.3bn per Bank of America Merrill Lynch, The Flow Show, 11-Apr-2019).
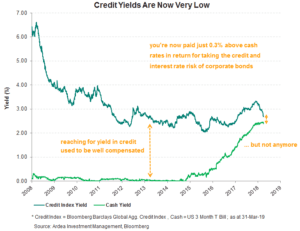
As a result of all this capital flooding back into credit markets, the ‘yield pick-up’ (i.e. additional yield) available from investing in credit is vanishing, as show in the chart below.
The yield pick-up from investing in a representative portfolio of global corporate bonds has now collapsed to just 0.3% above USD cash rates.
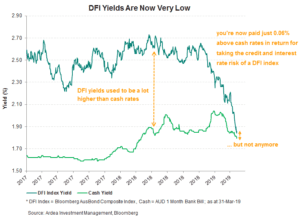
The next chart shows the equivalent yield pick-up offered by an AUD bond index that is widely referenced by conventional diversified fixed income (DFI) funds. This index comprises both government and corporate bonds, which DFI funds hold in their portfolios.
In some spots the reach for yield has pushed credit markets to incomprehensible levels.
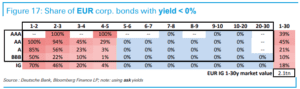
For example, as shown below, 18% of the entire EUR investment grade bond market now has NEGATIVE yields. Even in the lowest quality ‘BBB’ rated segment of the market, 50% of short dated bonds have negative yields. (Source: Deutsche Bank IG Strategy, 12-Apr-2019)
The obvious question that arises is whether credit investors are getting adequately compensated for the risks they are taking, which we have covered before. (Refer – why are you accepting more risk for less return)
The more subtle consideration for portfolio construction is how the behaviour of credit investments can change when yields are very low.
Compensation for credit risk
In the same way that companies can borrow money via loans from banks, they can also borrow money from investors by issuing bonds in corporate bond markets.
The interest rate that companies pay on these bonds is typically higher than what a government borrower would pay, which means the yield (or income) an investor earns from investing in corporate bonds is usually higher than what’s available from government bonds.
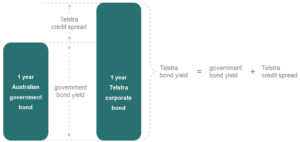
For example, in late 2018 Telstra issued a one year bond, which effectively means they borrowed money from bond investors for 1 year. At the time of writing, that bond offered an extra yield of 0.76% above what was available from investing in a one year Australian government bond.
That additional yield is called a ‘credit spread’. In this case, the term ‘spread’ refers to the difference in yield between a corporate and government bond.
The precise calculation of credit spreads can be complex, but for the purposes of this discussion it’s sufficient to conceptualise them like this;
And here’s the precise version, in case you’re interested;

Credit spreads represent additional compensation (i.e. higher yields) that investors demand in return for taking credit risk.
The most obvious component of credit risk is ‘default risk’, which is the risk that a bond issuer fails to repay investors according to the terms of a bond. Corporates typically (but not always) have higher default risk than governments and therefore investors demand additional compensation to invest in corporate bonds.
However, there is more to credit spreads than just default risk alone.
If you considered default risk alone, you would reach the erroneous conclusion that credit spreads represent free money to investors because they consistently over-compensate relative to actual default losses, which are rare.
However, this excess compensation is not free money. Rather, it compensates investors for all the other risks, beyond default risk, that they are exposed to. For IG bonds in particular, these other risks can actually be more important drivers of credit spreads (and bond returns) than default risk.
These include compensation for uncertainty, risk aversion, equity beta, funding risk, credit rating bias, fallen angel risk, recovery rates, tax effects, interest rate dynamics and liquidity risk. (Refer footnote 1 below).
It’s also important to understand that credit spreads, and therefore corporate bond prices, are dynamic. In the same way that equity valuations re-rate as a company’s prospects change, credit spreads also adjust to reflect changing market perceptions of credit risk.
When perceived credit risk grows, credit spreads increase, causing corporate bond yields to rise and prices to fall. The opposite happens when risk perception improves.
This means even long term investors in high quality corporate bonds can experience material volatility in their return profiles. For example, as Telstra’s business outlook worsened in 2018, its stock experienced significant volatility, its credit rating was downgraded, its credit spreads increased and bond prices dropped.
When reviewing the performance of credit investments, there can be a misconception that returns only come from the yield / income (i.e. the interest being paid on the bonds). While this is an important source of return, movements in credit spreads can actually be more important return drivers, particularly when yields are very low.
The two drivers of corporate bond returns
As explained in the previous section, the yield of a corporate bond can be split into two components;
- interest rate component – represented by the government bond yield
- credit component – represented by the credit spread
These two components exhibit varying sensitives to equity market fluctuations and can behave very differently as market conditions change. It’s their interaction that drives the total return from investing in a corporate bond, as well as the bond’s price volatility over time.
The interest rate component
The interest rate component of a corporate bond’s return is often (but not always) negatively correlated with equity prices, meaning it can push up corporate bond prices when equities fall.
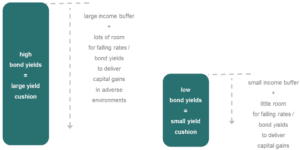
This is due to the ‘yield cushion’ effect.
The stable income provided by bonds, together with the possibility of falling interest rates / govt. bond yields delivering additional capital gains, combine to form the ‘yield cushion’.
In adverse market environments when equities fall, govt. bond yields can decline, resulting in capital gains on bonds. So as equity prices are falling, the yield cushion effect can push up bond prices.
The larger the yield cushion, the stronger this effect can be.
As an example, heading into the 2008 financial crisis the RBA cash rate and Australian govt. bond yields were in the 6% region, which meant the yield cushion was large.
Over the crisis period, govt. bonds delivered a decent income buffer and also provided large capital gains as interest rates / bond yields declined as equities fell … that was the yield cushion in action.
However, with yields now as low as they currently are, the yield cushion effect is much weaker.
The credit component
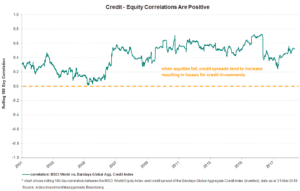
The credit component of a corporate bond’s return is nearly always positively correlated with equity prices, meaning that credit spreads increase as equities fall, pushing down corporate bond prices.
This happens because there is a strong underlying fundamental link between equity prices and credit spreads. The same factors that hurt equity markets (e.g. weakening economic conditions, poor corporate earnings) also hurt bond markets’ perception of credit risk.
In addition, the ‘flight to safety’ dynamic will cause outflows from credit markets. So it’s likely that credit markets will incur losses just as equities are falling.
This effect is strongest for lower quality corporate bonds but it still applies to even the highest rated investment grade bonds.
The positive correlation between corporate bond and equity prices is widely acknowledged across academic literature and also observed in practice, as shown below;
“The positive relationship between equity and corporate bond returns is also consistent with the Merton model and is by now a well-documented observation in the empirical literature (Cornell and Green, 1991; Shane, 1994; Reilly and Wright, 2001; Avramov, Jostova and Philipov, 2007).”
Norges Bank: Corporate Bonds In A Multi-Asset Portfolio, Sep 2017
The equity beta of credit investments can rise when yields are low
The sensitivity of credit investments to equity fluctuations (i.e. their equity beta) can vary depending on the level of bond yields because it’s the interaction between the interest rate and credit components of their returns that determines their performance.
When yields are high (i.e. yield cushions are large) corporate bonds tend to exhibit lower equity betas because the interest rate component, which can be negatively correlated to equities, tends to dominate bond performance.
For example, the higher starting point of bond yields heading into the 2008 financial crisis meant that yield cushions provided a sizeable buffer to offset much of the losses from rising credit spreads.
In these cases, gains from the interest rate component offset much of the losses from the credit component, thereby dampening losses on corporate bonds and reducing their sensitivity to falling equities.
However, when yields are low (i.e. yield cushions are small) corporate bonds tend to exhibit higher equity betas because the credit component, which is positively correlated to equities, tends to dominate bond performance.
We saw this behaviour in 2018 when yield cushions no longer provided much of a buffer against rising credit spreads, causing corporate bonds to experience a larger loss relative to the size of equity drawdowns than they did in 2008.
In these cases, gains from the interest rate component are insufficient to offset losses from the credit component, resulting in larger losses on corporate bonds and increasing their sensitivity to falling equities.
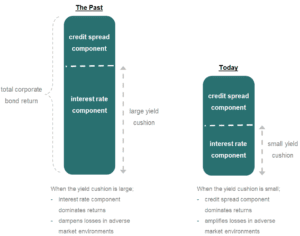
In the past, larger yield cushions gave corporate bonds a ‘get out of jail free’ card to help them ride through periods of equity market losses. Today, with yield cushions so small, the interest rate component is less able to provide that free pass when equities fall.
As a direct result of this, it’s prudent to expect the performance volatility and equity beta of corporate bonds to increase in adverse market environments going forward.
Hidden equity beta in fixed income portfolios
The difference between a pure government bond fund and a diversified fixed income (DFI) fund is the broader investment universe of the latter.
In addition to govt. bond exposure, DFI funds include investments that carry material credit risk, such as investment grade (IG) and high yield (HY) corporate bonds, emerging market debt and securitised investments.
While their broader remit can give access to higher returning assets during good times, it also comes with greater downside risk in adverse market environments due to credit and liquidity risk.
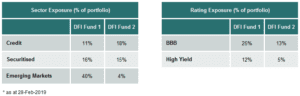
Since 2009, credit investments have been a favourite sub-asset class within fixed income for yield hungry investors. As a result, we’ve noticed a ‘credit creep’ phenomenon whereby DFI funds have consistently increased allocations to credit investments in search of higher yields.
For example, here are the portfolio allocations of two popular DFI funds;
In fact, this persistent credit overweight may have actually been THE dominant driver of DFI fund performance, as this research paper pointed out;
“We find remarkably consistent results across categories: a large portion of active FI manager returns can be explained by exposure to credit markets …
It does not necessarily imply that active FI mangers are buying HY corporate bonds en-masse. But it does suggest whatever it is they are doing (carry trades, overweighting securitized assets that embed credit risk, etc.) ends up providing the investor with something that resembles – and is highly correlated with – HY exposure.
This is hardly comforting for an investment into an asset class that is meant to provide diversification from equity markets”
AQR, “The Illusion of Active Fixed Income Diversification” 4Q17
It’s therefore not surprising that DFI funds generally did well from 2009 to 2017, as credit markets experienced one of their biggest bull markets ever over this period.
While these credit exposures have historically driven higher returns, they come at the cost of introducing equity beta into these portfolios, which compromises their diversification and downside protection benefits in adverse market environments.
The equity beta in DFI funds was not obvious over this period because credit and equities were generally in a bull market and when occasional equity drawdowns occurred, the large yield cushions dampened the sensitivity of corporate bonds to equity losses.
However, when yield cushions are smaller, the equity beta in DFI portfolios becomes more pronounced, which is what happened in the fourth quarter of 2018, when many DFI and similarly unconstrained fixed income portfolios incurred steep losses on their credit exposures as equities fell.
For this reason, we view these portfolios as having ‘latent equity beta’.
Their equity sensitivity is latent in the sense that it’s hidden most of the time but can become very pronounced in adverse market environments, causing the largest losses for these portfolios when equities fall the most … precisely when the ‘defensiveness’ of fixed income is needed most.
For example, the table below shows the 2018 performance of the Barclays Global Aggregate Index, which is the most widely used benchmark index for global DFI funds.
As the yield cushion was unable to offset the credit exposures in the index, its latent equity beta surfaced at the worst possible time, resulting in a negative return just as equities also experienced a large drawdown.
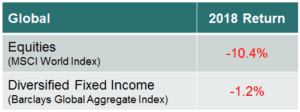
On a standalone basis a negative 1.2% return doesn’t seem large, but that’s really not the point.
DFI investments are expected to play a defensive and risk diversifying role in portfolios … basically they DFI should do well when equities fall. In that context, a negative return of any magnitude when equities fall a lot is a really bad outcome.
For portfolios that already have material equity holdings, adding the credit exposure inherent in DFI investments could result in doubling up on the same type of risk, and indeed this was the central finding of a study undertaken by one of the world’s largest sovereign wealth funds;
“… an allocation to corporate bonds has historically increased the overall volatility of multi-asset portfolios dominated by equity risk.”
Norges Bank: Corporate Bonds In A Multi-Asset Portfolio, Sep 2017
Achieving genuine risk diversification
Credit investments generally and the allocation to corporate bonds in DFI funds specifically, is neither inherently good nor bad. As with any investment, there are risk vs. return trade-offs that can either improve or detract from returns when these exposures are added to a broader investment portfolio.
The more nuanced consideration is around how these exposures will behave in different scenarios, how those behaviours can change in varying market environments and how they will interact with other assets in the portfolio.
Looking beyond labels, investments that are commonly assumed to provide diversification benefits and downside protection against equity risk, may behave this way in some market environments but at other times can actually behave the opposite way and incur losses just as equities fall.
Indeed, this is why it’s important to look beyond labels and understand the causal relationships that exist between the different assets in a portfolio.
Within fixed income, two types of investments can help provide genuine risk diversification benefits for portfolios that already have equity and credit exposures;
- investments that maintain reliably low correlation to equity and credit markets when those markets incur losses
- investments that have complementary risk and return profiles to equity and credit assets
An example of the former would be non-conventional strategies, whose return sources have no underlying fundamental or structural links to equities or credit.
An example of the latter would be interest rate volatility strategies, whose return profiles can be structured to provide additional upside when equity and credit markets incur losses.
Both can help portfolios achieve the risk diversification that is essential to successfully navigating the inevitable periods of volatility that hit equity and credit markets.
1 uncertainty – because we can’t predict expected default losses with certainty; risk aversion – corporate bonds have asymmetric return profiles with limited upside vs. disproportionately large downside; equity beta – corporate bonds follow economic cycles just as equities do; funding risk – many market participants are sensitive to their own funding costs when investing in corporate bonds; credit rating bias – already highly rated bonds are more at risk of downgrade than upgrade; fallen angel risk – many investors can only hold bonds with a certain credit rating and can therefore be forced to sell and crystallise a loss on a downgrade; recovery rates – how much you recover from selling the company’s assets in liquidation can vary through economic cycles; tax effects – corporate and government bonds can be taxed differently; interest rate dynamics – correlations between credit spreads and interest rates vary through cycles; liquidity risk – inability to sell bonds in a timely manner without punitive costs.